
OUR QUARTERLY NEWSLETTER TO CLIENTS AND FRIENDS OF THE FIRM
THIRD QUARTER 2026
The Upside of Higher Interest Rates
Short-Term Pain, Long-Term Gain
There is an interesting irony in the Federal Reserve raising interest rates. Why does the Fed raise rates? The Fed raises rates to bring down inflation by making borrowing more expensive, while accepting the risk of slowing down the economy as a result.
For investors, that can feel like bad news at first, since bond prices fall when rates rise. Yet for disciplined, long-term investors, higher rates can ultimately be very good news.
Why Own Bonds?
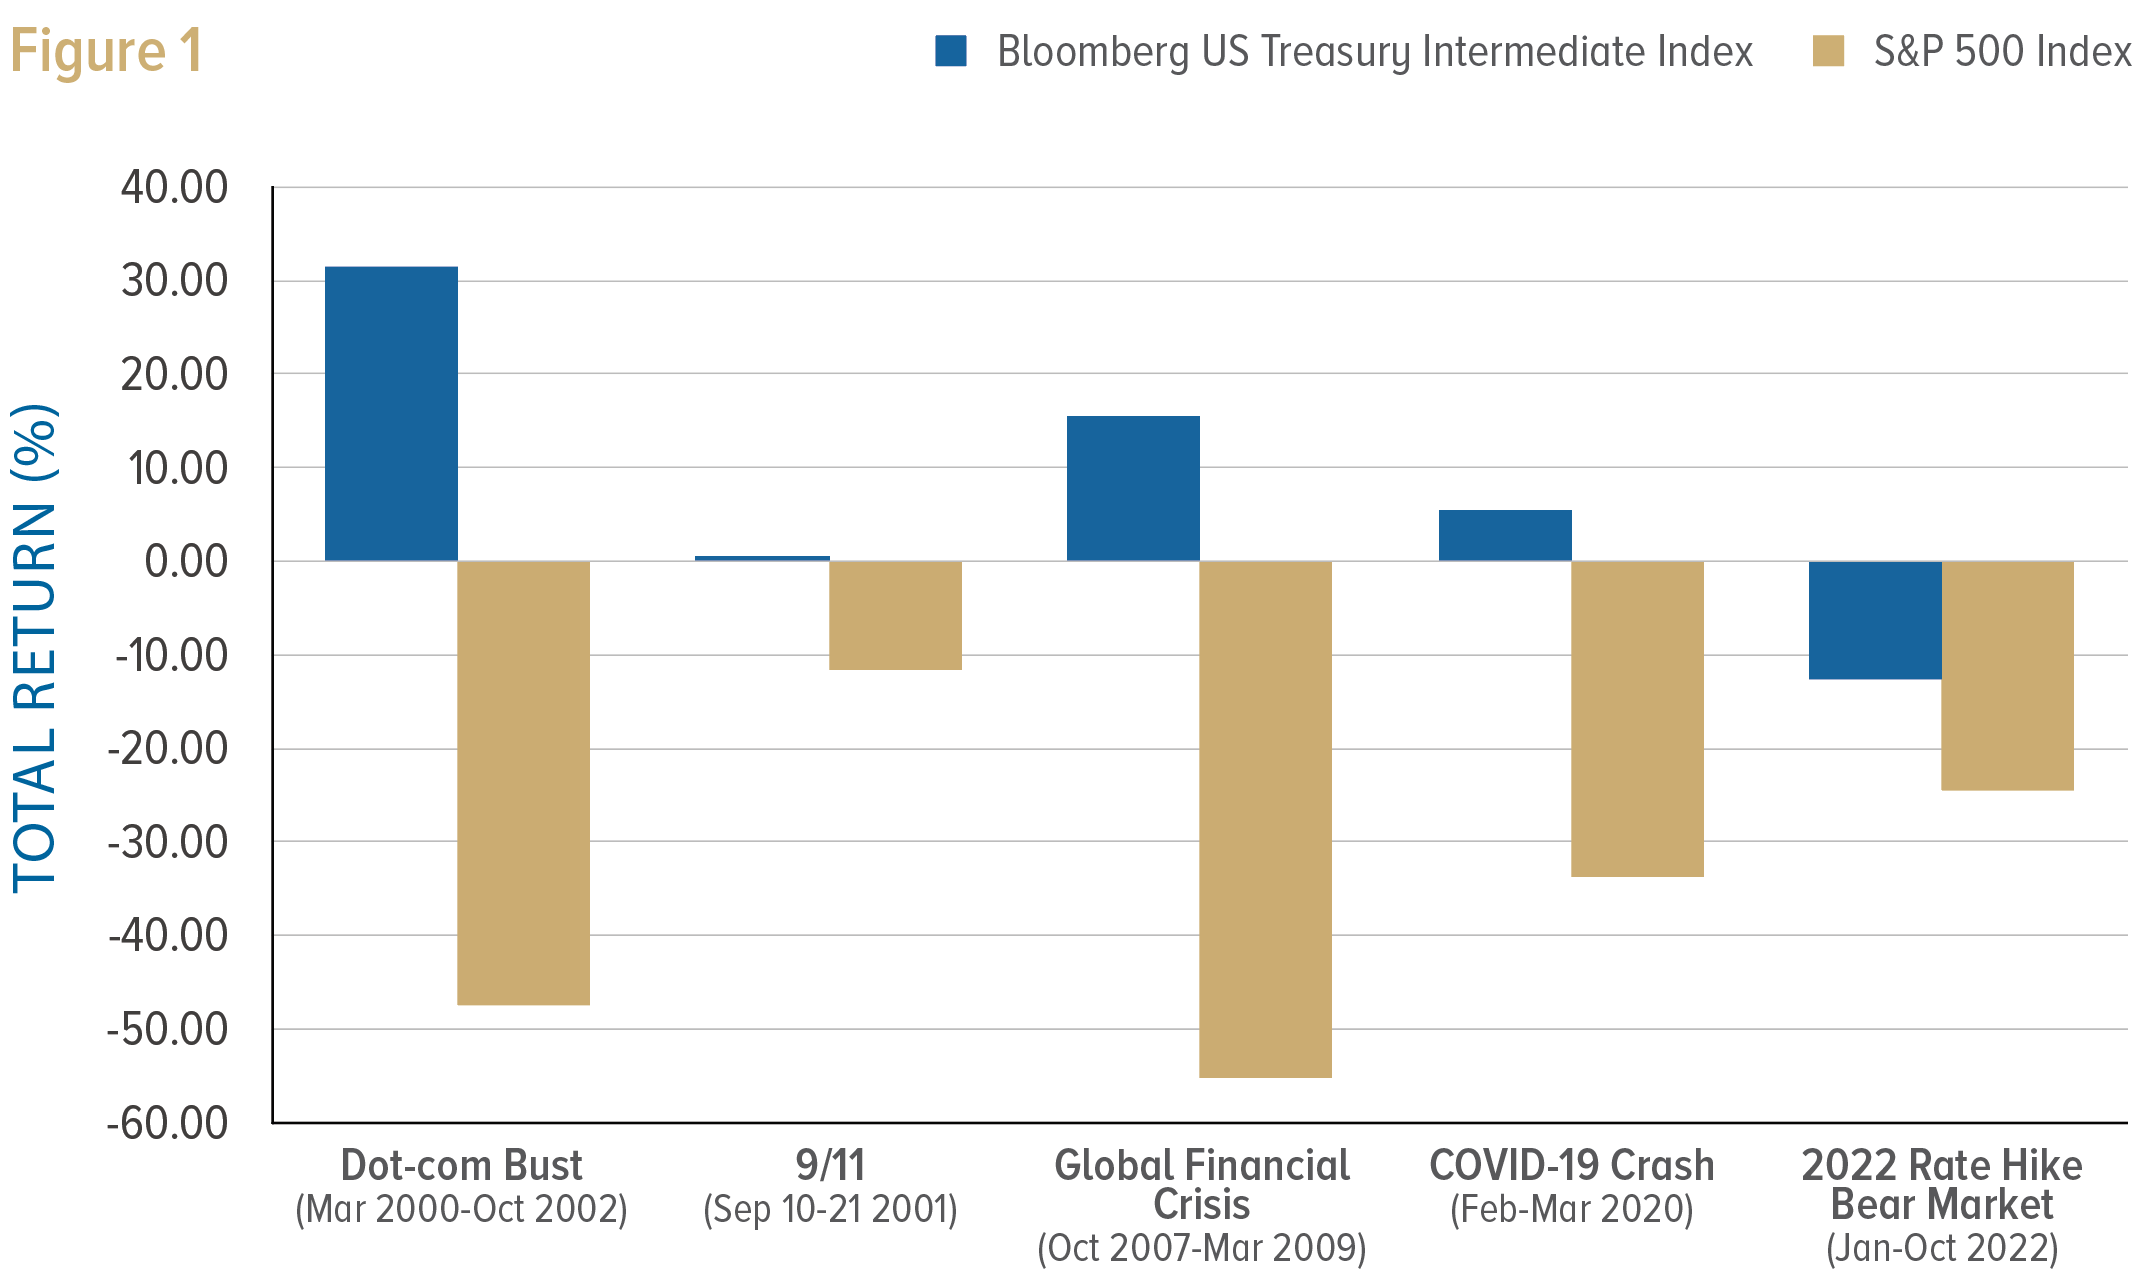
We own bonds for stability. They are the ballast in a diversified portfolio. With the notable exception of 2022 (see Figure 1), in past stock market declines, high-quality bonds have held their value and provided the liquidity to rebalance into stocks when prices were depressed. Bonds are not meant to outperform stocks. Their job is to generate income, preserve capital and dampen volatility so that investors can stay the course.
How Bonds Work
Bonds have a wonderful symmetry. Inflation, historically 2% to 3%, provides an anchor.1 Short-term bonds pay a bit more than inflation to reward savers for postponing spending, and longer-term bonds add a premium for committing money longer. The result has historically been 10-year Treasury yields of roughly 4% to 5%, not far from today’s levels.2 There is nothing extraordinary about today’s rates. What was extraordinary was the ultra-low-rate environment of the past 15 years, a product of the financial crisis, persistently low inflation and pandemic-era intervention.
There is a second symmetry. When rates rise, existing bond prices fall, which is the short-term pain we have felt recently. But as those bonds mature, the proceeds are reinvested at higher yields. Today’s pain sets the stage for better returns tomorrow.
Is the Bond Market Signaling Trouble?
Bond markets have a keen eye for trouble; worries about recession, inflation or default show up quickly in prices. Today we see little such evidence. Futures markets are not pricing an extreme rate environment, and credit spreads, the extra yield investors demand to own corporate bonds rather than Treasuries, remain contained.
Rates could still move higher, but today’s yields look far more like a normalization than a flashing red warning light.
Why We Don’t Buy Long Bonds
This environment also illustrates why we generally avoid long-term bonds. During the third quarter, the Bloomberg U.S. Aggregate Bond Index declined 3.5%.3 As Archimedes observed, “Give me a lever long enough, and I shall move the world.” In the bond market, that lever is duration, which magnifies every move in rates: Treasuries maturing in more than 20 years lost 9% over the same period.4 A 20-year Treasury may carry virtually no credit risk, but waiting 20 years while earning a below-market coupon is a very real opportunity cost. We do not believe that extra risk is well compensated. High quality does not mean low volatility.
Stocks Versus Bonds
Finally, higher yields change the most basic decision investors make: stocks versus bonds. Nobel laureate Robert Shiller’s Excess CAPE Yield compares the inflation-adjusted earnings yield of stocks with long-term Treasury yields. In essence, it asks how well investors are being paid to accept the additional risk of stocks. For much of the post-crisis era, ultra-low bond yields made stocks the only game in town.
That has changed. With bond yields substantially higher, stocks no longer enjoy the lopsided advantage they held for most of the past decade, and bonds are once again a legitimate competitor for capital.
For balanced portfolios, that is welcome news. After more than a decade handicapped by low rates, bonds once again offer meaningful income, real diversification and the ballast we want when stocks turn turbulent. Short-term bond losses are never pleasant. But for disciplined, long-term investors, higher interest rates may prove less a problem than an opportunity.
The Thucydides Trap:
A Lesson for Investors
Chinese President Xi Jinping has repeatedly invoked an intriguing historical concept when discussing relations with the United States: the “Thucydides Trap.”
The term comes from the Greek historian Thucydides and his account of the Peloponnesian War nearly 2,500 years ago. A rising Athens was challenging Sparta, the established power, and Thucydides observed that the growth of Athens, and the fear it instilled in Sparta, made war nearly inevitable.
Harvard political scientist Graham Allison brought the idea into the modern era, identifying 16 cases over the past 500 years in which a rising power threatened to displace an established one. Twelve ended in war.
That history makes Xi’s references so interesting, because China’s extraordinary rise increasingly challenges America’s position as the world’s dominant superpower. Xi’s argument is that history need not repeat itself and that great-power competition does not have to end in confrontation. The historical odds are not encouraging, but they are not destiny. The two countries are bound together by trade, capital and supply chains in ways Athens and Sparta never were, and both have far more to lose from conflict than to gain. The trap can be avoided, even if it should not be ignored.
Whatever the outcome, the Thucydides Trap is a useful reminder that economic leadership and geopolitical influence shift over time. For investors, that is a compelling argument for diversification. U.S. markets have enjoyed extraordinary success, but history suggests no country holds market leadership indefinitely. Owning companies across countries and regions allows investors to participate wherever the next generation of global growth emerges.

Thee AI Build-Out Is Becoming the Biggest Economic Bet in U.S. History
Data-center spending is greater than that for the canals, railroads and grid combined—creating jobs and wealth but also boosting inflation.
By Konrad Putzier and Justin Lahart
Sept. 23, 2026 at 9:00 pm ET
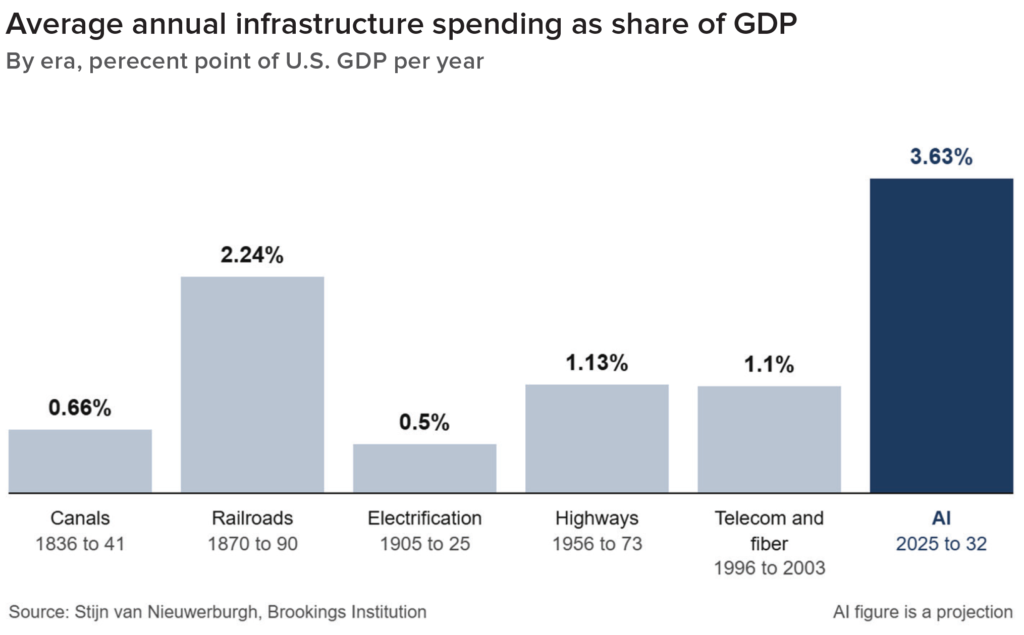
The AI build-out is on track to become the biggest economic bet in U.S. history, dwarfing the investments made to fund other huge U.S. infrastructure projects such as the railroads, the highway system and the plumbing for the internet.
Total investment in data centers and related artificial-intelligence infrastructure is projected to total $10.3 trillion from 2025 to 2032, according to new estimates by economist Stijn van Nieuwerburgh published by the Brookings Institution. Th at is a staggering 3.6% of gross domestic product a year, on average. Never before has the U.S. economy been so dependent on the build-out of a single industry.
The investment is transforming every corner of the economy, creating hundreds of thousands of jobs and minting new billionaires.
It is also creating significant risk, as much of it is built on debt. An abrupt slowdown could ignite shock waves throughout the U.S. economy.
Projecting investment is tricky, and total spending might well end up substantially lower. Still, the money poured into data centers this year already represents an investment unprecedented in recent history. AI investment in the U.S. is projected to hit 1.9% of GDP in 2026, according to new estimates from Goldman Sachs. Th e railroad boom of the late 19th century marked the last time the build-out of one new industry accounted for a larger share of the economy.
Here are some important impacts all that money is having on the economy:
Construction
The flood of money spent on the build-out of data centers has represented a bright spot in an otherwise dark time for the construction industry.
Through July of this year, a seasonally adjusted $37 billion has been spent on private data-center construction— about $9 billion more than in the first seven months of last year, according to the Commerce Department.
Private construction spending on everything else—houses, apartment buildings, shopping centers and so on—was about $46 billion below year earlier levels in the first seven months of this year.
Hyperscalers are tying up scarce workers and electricity, raising costs for other businesses. The Federal Reserve Bank of Richmond recently reported that data-center construction is straining labor availability in its area. It isn’t just electricity: In many places, data centers are pushing up land costs. “It’s crowding out manufacturing,” said Didi Caldwell, a site-selection consultant who works with heavy industry.
Financing and risk
Analysts estimate that capital spending at five of the so-called hyperscalers—Alphabet, Amazon.com, Meta Platforms, Microsoft and Oracle—will be $4.2 trillion in the four years ending in 2029, according to FactSet. A growing share of that spending is financed by debt. That level of spending raises risks for the financial sector if the boom goes bust. Van Nieuwerburgh said often tech companies use off-balance-sheet entities to borrow from banks and private-credit firms, and those deals usually come with little public reporting. The practice makes it hard to figure out how great the financial risks are, he added. If AI doesn’t generate enough revenue to service the debt raised to build data centers, the fallout could ripple through the financial system.
Jobs
Economists are divided over whether AI is now meaningfully hurting employment among white-collar workers. What is clear, however, is that the build-out is putting some workers in very high demand. AI was behind more than 750,000 new jobs in the U.S. from 2023 through 2026 to-date, according to LinkedIn estimates. And those jobs pay well: The median salary for AI-related job listings on LinkedIn is around $180,000, compared with $80,000 for all jobs. “It’s one of the robust areas of a very slow labor market,” said Kory Kantenga, LinkedIn’s head of economics for the Americas.
White-collar jobs such as data annotator and AI engineer account for most of the new positions, but employers have also added 117,000 jobs at data centers since the start of 2024. That doesn’t count construction jobs, many of which aren’t permanent.
In the Washington, D.C., area, the number of unionized electricians has risen from 9,000 to 17,500 in recent years, according to Don Slaiman, political coordinator of the trade union IBEW Local 26. “A lot of folks come here to pay off their college debt,” he said. Kwaku Afriyie, 23 years old, has a college degree in cybersecurity and was working in an entry-level IT role when he started worrying about AI taking away his job. Last year he switched careers and became an electrician. Now he assembles components for data centers, making around $30 an hour as an apprentice.
More seasoned workers earn twice that rate. Tyler Beam, 28, has spent most of the past two years building data centers and working for a company that sends prefabricated parts to Amazon data-center construction sites across the country. Most recently, the electrician made $62 an hour, plus overtime. Beam often worked 58 hours a week, sometimes earning double pay. “They want to put them up as fast as possible,” he said. The earnings have boosted his spending: Beam recently bought a GMC Yukon and is house-hunting.
The wealth effect
The AI-powered rally has led to huge gains in stock-market wealth. As of the second quarter, U.S. stock and mutual fund holdings came to $63 trillion, according to the Federal Reserve—nearly double the amount at the end of 2022. The trend has buoyed consumer spending even as inflation-adjusted wage growth has faltered. The gains have been
particularly pronounced for the welloff, who tend to have more of their net worth tied up in stocks than the middle class do.
Nationwide, home sales have been mired in a four-year slump. But in Silicon Valley, AI money is fueling a surge in luxury-home sales. “This is the best it’s been since 2000,” said Ken DeLeon, a real-estate agent. DeLeon recently listed a five-bedroom home for $9.9 million. He got seven offers, and within two weeks it was in contract for more than $13 million. The winning bidder: an AI entrepreneur.
Appeared in the September 24, 2026, print edition as ‘U.S.’s AI Build-Out Is on Track As Biggest-Ever Economic Bet’.
Disclosures: Past performance is no guarantee of future results.
1: US Bureau of Labor Statistics CPI.
2: US FRED Data 1953-Present.
3: AGG ETF return Q3 2026.
4: TLT ETF return Q3 2026.
Figure 1: Data courtesy of Bloomberg, consisting of the Bloomberg US Intermediate Treasury Index vs the S&P 500 Index for notable time periods of negative equity performance since 2000. For illustrative purposes only.