
Category: Quarterly Newsletters

  • 3rd Quarter 2026

    OUR QUARTERLY NEWSLETTER TO CLIENTS AND FRIENDS OF THE FIRM

    THIRD QUARTER 2026


    The Upside of Higher Interest Rates

    There is an interesting irony in the Federal Reserve raising interest rates. Why does the Fed raise rates? The Fed raises rates to bring down inflation by making borrowing more expensive, while accepting the risk of slowing down the economy as a result.

    For investors, that can feel like bad news at first, since bond prices fall when rates rise. Yet for disciplined, long-term investors, higher rates can ultimately be very good news.

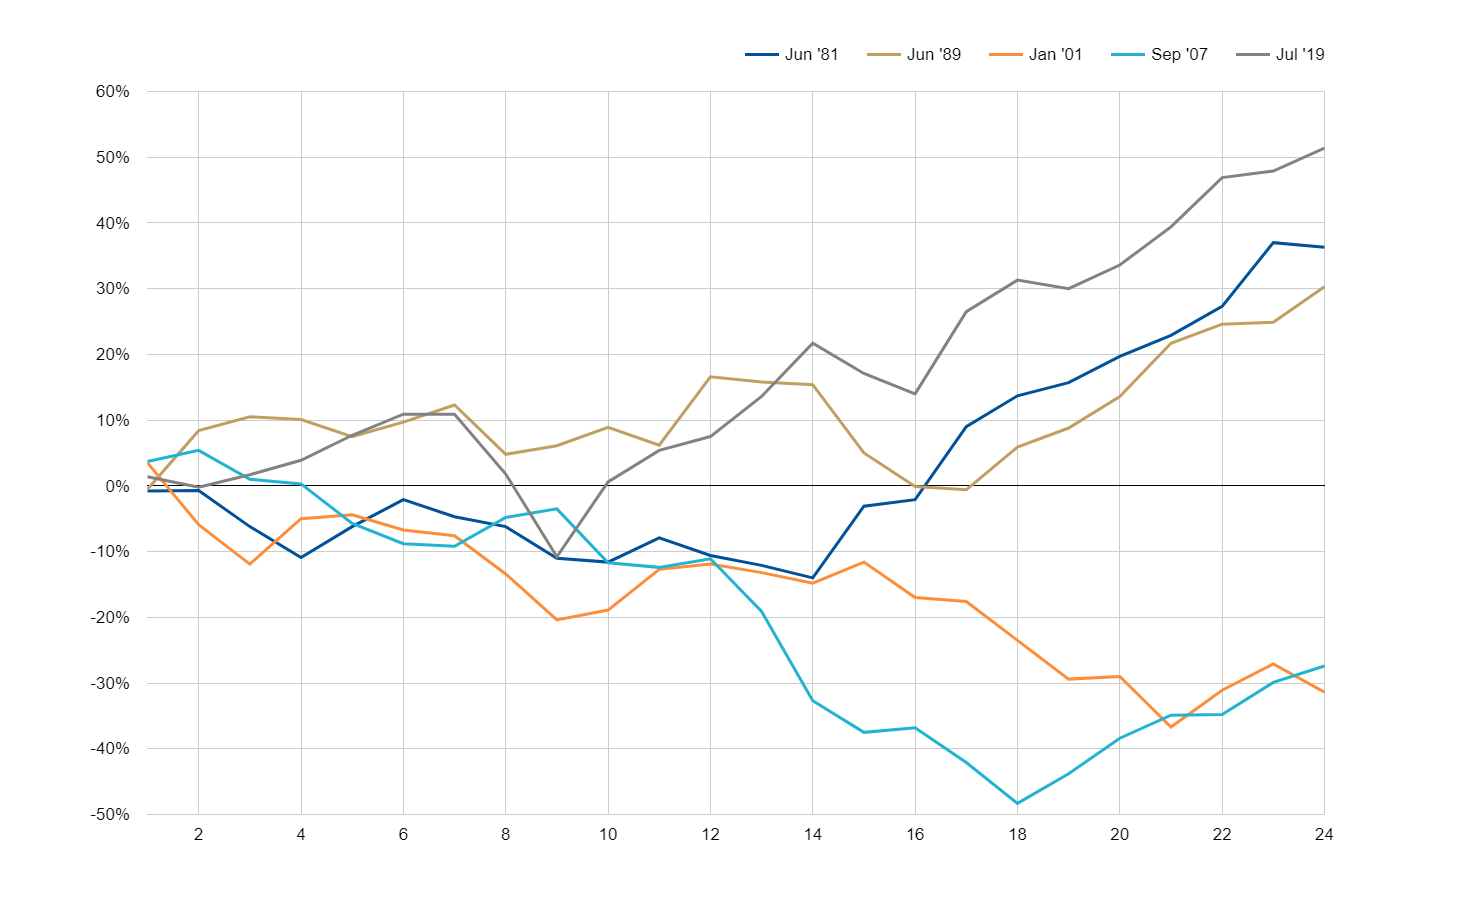
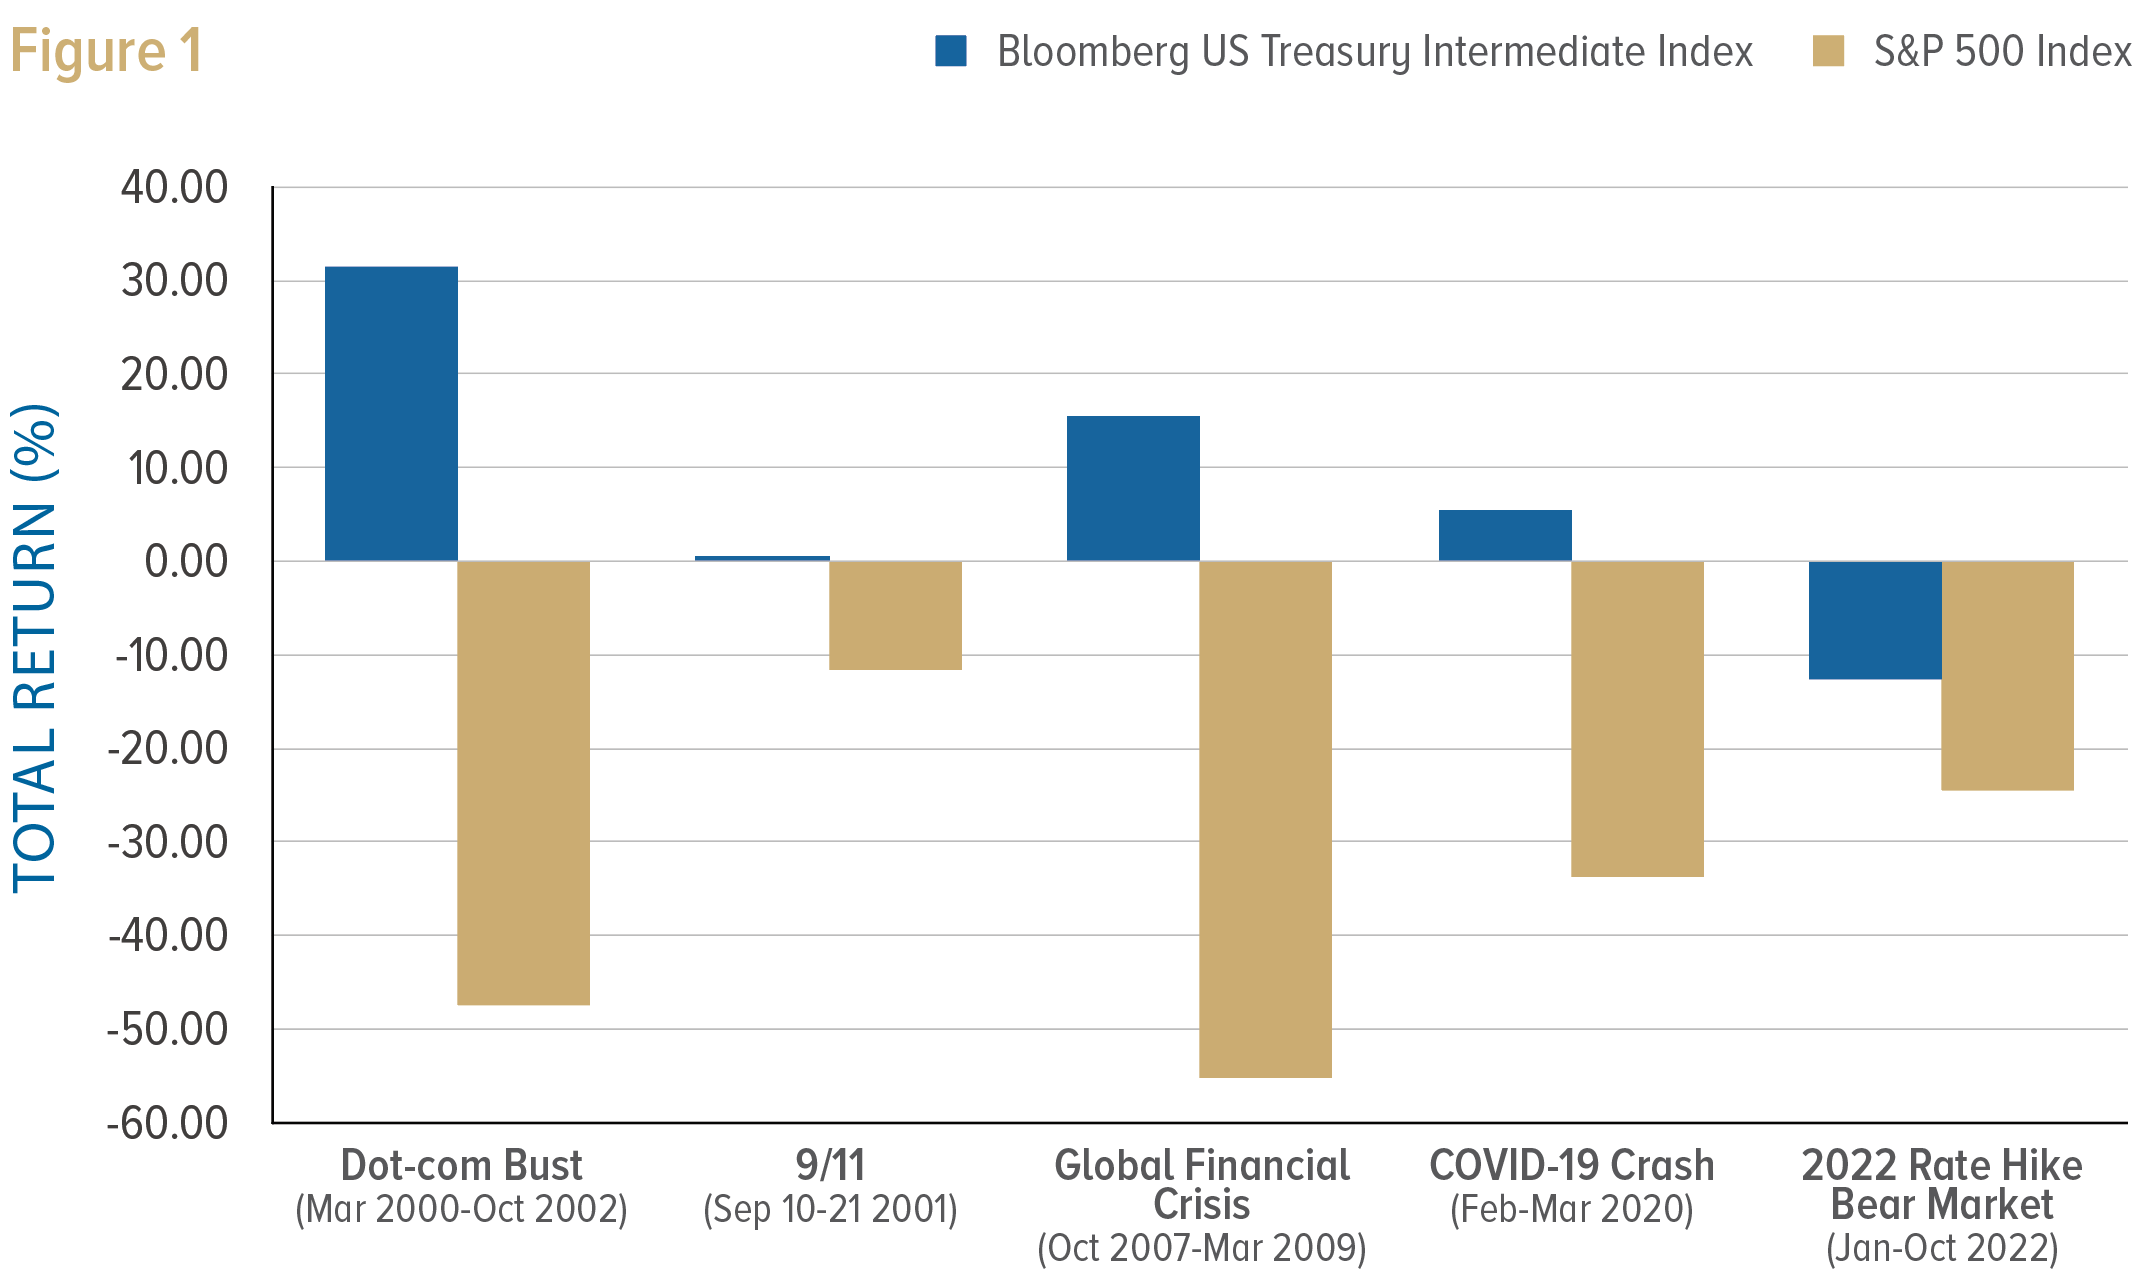
    We own bonds for stability. They are the ballast in a diversified portfolio. With the notable exception of 2022 (see Figure 1), in past stock market declines, high-quality bonds have held their value and provided the liquidity to rebalance into stocks when prices were depressed. Bonds are not meant to outperform stocks. Their job is to generate income, preserve capital and dampen volatility so that investors can stay the course.

    Bonds have a wonderful symmetry. Inflation, historically 2% to 3%, provides an anchor.1 Short-term bonds pay a bit more than inflation to reward savers for postponing spending, and longer-term bonds add a premium for committing money longer. The result has historically been 10-year Treasury yields of roughly 4% to 5%, not far from today’s levels.2 There is nothing extraordinary about today’s rates. What was extraordinary was the ultra-low-rate environment of the past 15 years, a product of the financial crisis, persistently low inflation and pandemic-era intervention.

    There is a second symmetry. When rates rise, existing bond prices fall, which is the short-term pain we have felt recently. But as those bonds mature, the proceeds are reinvested at higher yields. Today’s pain sets the stage for better returns tomorrow.
    Bond markets have a keen eye for trouble; worries about recession, inflation or default show up quickly in prices. Today we see little such evidence. Futures markets are not pricing an extreme rate environment, and credit spreads, the extra yield investors demand to own corporate bonds rather than Treasuries, remain contained.

    Rates could still move higher, but today’s yields look far more like a normalization than a flashing red warning light.

    This environment also illustrates why we generally avoid long-term bonds. During the third quarter, the Bloomberg U.S. Aggregate Bond Index declined 3.5%.3 As Archimedes observed, “Give me a lever long enough, and I shall move the world.” In the bond market, that lever is duration, which magnifies every move in rates: Treasuries maturing in more than 20 years lost 9% over the same period.4 A 20-year Treasury may carry virtually no credit risk, but waiting 20 years while earning a below-market coupon is a very real opportunity cost. We do not believe that extra risk is well compensated. High quality does not mean low volatility.

    Finally, higher yields change the most basic decision investors make: stocks versus bonds. Nobel laureate Robert Shiller’s Excess CAPE Yield compares the inflation-adjusted earnings yield of stocks with long-term Treasury yields. In essence, it asks how well investors are being paid to accept the additional risk of stocks. For much of the post-crisis era, ultra-low bond yields made stocks the only game in town.

    That has changed. With bond yields substantially higher, stocks no longer enjoy the lopsided advantage they held for most of the past decade, and bonds are once again a legitimate competitor for capital.

    For balanced portfolios, that is welcome news. After more than a decade handicapped by low rates, bonds once again offer meaningful income, real diversification and the ballast we want when stocks turn turbulent. Short-term bond losses are never pleasant. But for disciplined, long-term investors, higher interest rates may prove less a problem than an opportunity.

    The Thucydides Trap:
    A Lesson for Investors

    Chinese President Xi Jinping has repeatedly invoked an intriguing historical concept when discussing relations with the United States: the “Thucydides Trap.”

    The term comes from the Greek historian Thucydides and his account of the Peloponnesian War nearly 2,500 years ago. A rising Athens was challenging Sparta, the established power, and Thucydides observed that the growth of Athens, and the fear it instilled in Sparta, made war nearly inevitable.

    Harvard political scientist Graham Allison brought the idea into the modern era, identifying 16 cases over the past 500 years in which a rising power threatened to displace an established one. Twelve ended in war.

    That history makes Xi’s references so interesting, because China’s extraordinary rise increasingly challenges America’s position as the world’s dominant superpower. Xi’s argument is that history need not repeat itself and that great-power competition does not have to end in confrontation. The historical odds are not encouraging, but they are not destiny. The two countries are bound together by trade, capital and supply chains in ways Athens and Sparta never were, and both have far more to lose from conflict than to gain. The trap can be avoided, even if it should not be ignored.

    Whatever the outcome, the Thucydides Trap is a useful reminder that economic leadership and geopolitical influence shift over time. For investors, that is a compelling argument for diversification. U.S. markets have enjoyed extraordinary success, but history suggests no country holds market leadership indefinitely. Owning companies across countries and regions allows investors to participate wherever the next generation of global growth emerges.

    By Konrad Putzier and Justin Lahart
    Sept. 23, 2026 at 9:00 pm ET

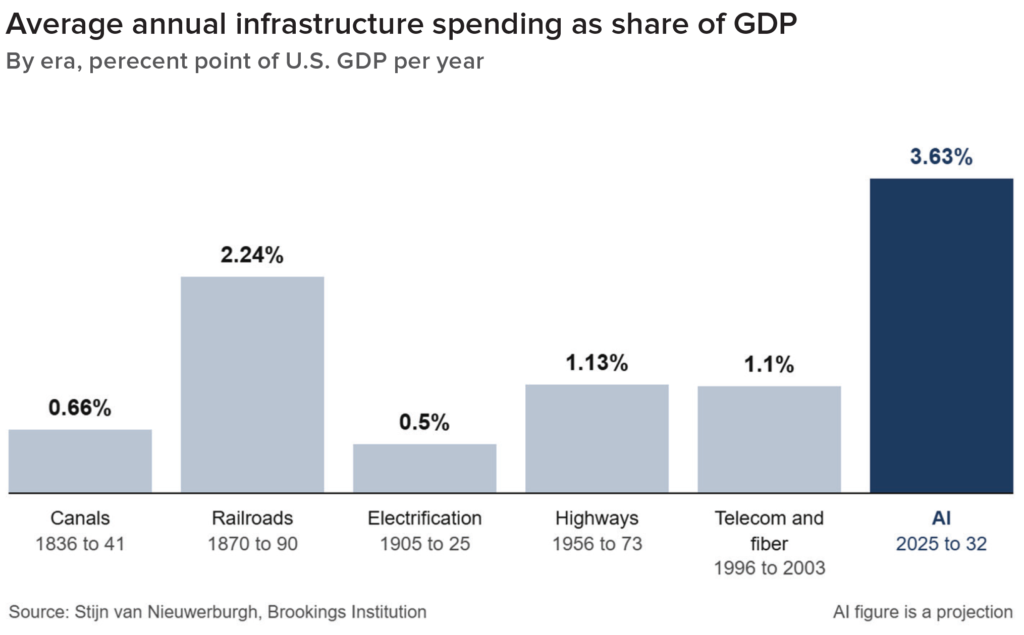
    The AI build-out is on track to become the biggest economic bet in U.S. history, dwarfing the investments made to fund other huge U.S. infrastructure projects such as the railroads, the highway system and the plumbing for the internet.

    Total investment in data centers and related artificial-intelligence infrastructure is projected to total $10.3 trillion from 2025 to 2032, according to new estimates by economist Stijn van Nieuwerburgh published by the Brookings Institution. Th at is a staggering 3.6% of gross domestic product a year, on average. Never before has the U.S. economy been so dependent on the build-out of a single industry.

    The investment is transforming every corner of the economy, creating hundreds of thousands of jobs and minting new billionaires.

    It is also creating significant risk, as much of it is built on debt. An abrupt slowdown could ignite shock waves throughout the U.S. economy.

    Projecting investment is tricky, and total spending might well end up substantially lower. Still, the money poured into data centers this year already represents an investment unprecedented in recent history. AI investment in the U.S. is projected to hit 1.9% of GDP in 2026, according to new estimates from Goldman Sachs. Th e railroad boom of the late 19th century marked the last time the build-out of one new industry accounted for a larger share of the economy.
    Here are some important impacts all that money is having on the economy:

    Construction

    The flood of money spent on the build-out of data centers has represented a bright spot in an otherwise dark time for the construction industry.

    Through July of this year, a seasonally adjusted $37 billion has been spent on private data-center construction— about $9 billion more than in the first seven months of last year, according to the Commerce Department.

    Private construction spending on everything else—houses, apartment buildings, shopping centers and so on—was about $46 billion below year earlier levels in the first seven months of this year.

    Hyperscalers are tying up scarce workers and electricity, raising costs for other businesses. The Federal Reserve Bank of Richmond recently reported that data-center construction is straining labor availability in its area. It isn’t just electricity: In many places, data centers are pushing up land costs. “It’s crowding out manufacturing,” said Didi Caldwell, a site-selection consultant who works with heavy industry.

    Financing and risk

    Analysts estimate that capital spending at five of the so-called hyperscalers—Alphabet, Amazon.com, Meta Platforms, Microsoft and Oracle—will be $4.2 trillion in the four years ending in 2029, according to FactSet. A growing share of that spending is financed by debt. That level of spending raises risks for the financial sector if the boom goes bust. Van Nieuwerburgh said often tech companies use off-balance-sheet entities to borrow from banks and private-credit firms, and those deals usually come with little public reporting. The practice makes it hard to figure out how great the financial risks are, he added. If AI doesn’t generate enough revenue to service the debt raised to build data centers, the fallout could ripple through the financial system.

    Jobs

    Economists are divided over whether AI is now meaningfully hurting employment among white-collar workers. What is clear, however, is that the build-out is putting some workers in very high demand. AI was behind more than 750,000 new jobs in the U.S. from 2023 through 2026 to-date, according to LinkedIn estimates. And those jobs pay well: The median salary for AI-related job listings on LinkedIn is around $180,000, compared with $80,000 for all jobs. “It’s one of the robust areas of a very slow labor market,” said Kory Kantenga, LinkedIn’s head of economics for the Americas.

    White-collar jobs such as data annotator and AI engineer account for most of the new positions, but employers have also added 117,000 jobs at data centers since the start of 2024. That doesn’t count construction jobs, many of which aren’t permanent.

    In the Washington, D.C., area, the number of unionized electricians has risen from 9,000 to 17,500 in recent years, according to Don Slaiman, political coordinator of the trade union IBEW Local 26. “A lot of folks come here to pay off their college debt,” he said. Kwaku Afriyie, 23 years old, has a college degree in cybersecurity and was working in an entry-level IT role when he started worrying about AI taking away his job. Last year he switched careers and became an electrician. Now he assembles components for data centers, making around $30 an hour as an apprentice.

    More seasoned workers earn twice that rate. Tyler Beam, 28, has spent most of the past two years building data centers and working for a company that sends prefabricated parts to Amazon data-center construction sites across the country. Most recently, the electrician made $62 an hour, plus overtime. Beam often worked 58 hours a week, sometimes earning double pay. “They want to put them up as fast as possible,” he said. The earnings have boosted his spending: Beam recently bought a GMC Yukon and is house-hunting.

    The wealth effect

    The AI-powered rally has led to huge gains in stock-market wealth. As of the second quarter, U.S. stock and mutual fund holdings came to $63 trillion, according to the Federal Reserve—nearly double the amount at the end of 2022. The trend has buoyed consumer spending even as inflation-adjusted wage growth has faltered. The gains have been
    particularly pronounced for the welloff, who tend to have more of their net worth tied up in stocks than the middle class do.

    Nationwide, home sales have been mired in a four-year slump. But in Silicon Valley, AI money is fueling a surge in luxury-home sales. “This is the best it’s been since 2000,” said Ken DeLeon, a real-estate agent. DeLeon recently listed a five-bedroom home for $9.9 million. He got seven offers, and within two weeks it was in contract for more than $13 million. The winning bidder: an AI entrepreneur.

    Appeared in the September 24, 2026, print edition as ‘U.S.’s AI Build-Out Is on Track As Biggest-Ever Economic Bet’.


    Disclosures: Past performance is no guarantee of future results.
    1: US Bureau of Labor Statistics CPI.
    2: US FRED Data 1953-Present.
    3: AGG ETF return Q3 2026.
    4: TLT ETF return Q3 2026.
    Figure 1: Data courtesy of Bloomberg, consisting of the Bloomberg US Intermediate Treasury Index vs the S&P 500 Index for notable time periods of negative equity performance since 2000. For illustrative purposes only.
  • 2nd Quarter 2026

    OUR QUARTERLY NEWSLETTER TO CLIENTS AND FRIENDS OF THE FIRM

    SECOND QUARTER 2026


    IPO Exuberance and Picking Winners

    Few financial events this year generated more excitement than the SpaceX IPO—a fitting occasion to revisit former Federal Reserve Chairman Alan Greenspan’s famous warning about “irrational exuberance.” Greenspan coined the phrase in 1996 to describe the excessive optimism surrounding internet stocks. Many dismissed his comments at the time, yet history proved him correct when the NASDAQ Composite ultimately lost nearly 80% of its value in the dot-com collapse. His warning, however, arrived more than three years before the market peaked—a reminder that enthusiasm can persist far longer than fundamentals alone might justify.

    An Initial Public Offering is the first time a privately held company offers shares on a public exchange, typically to raise capital or to provide liquidity for founders, employees, and early investors. From an investment perspective, however, an IPO is primarily a financing event for the company and a liquidity event for existing shareholders—not necessarily a chance for new investors to buy at an attractive valuation. Decades of academic research bear this out: on average, newly public companies have underperformed the broader market by roughly 1% over their first year.1

    Underwriters also have strong incentives for an offering to be viewed as a success. To stimulate demand, shares are often priced modestly below what institutional investors expect to pay, creating the familiar “first-day pop.” While this generates positive headlines, much of that initial appreciation is captured by institutions that receive allocations before most individuals can participate.

    SpaceX appears to be no exception. In the first few days on the market, shares surged to more than $200 per share before retreating toward their initial trading price of around $120 today. Meanwhile, the company’s narrative has broadened from space exploration to AI infrastructure, satellite communications, and space-based computing. At its IPO price, SpaceX traded at an extraordinarily high multiple of revenue despite inconsistent profitability. Investors are effectively valuing what the company could become over the next decade rather than what it earns today.

    SpaceX’s expanding ambitions point to a deeper lesson. Firms that once had little connection to artificial intelligence now routinely position it at the center of their strategy, a reminder that identifying a revolutionary technology is often far easier than picking the winners that will ultimately profit most from it. Consider the early internet. Numerous web-browsers competed for dominance, including Lynx and Netscape, yet the company that became one of the greatest technology success stories was Google, who was neither the first browser nor an early entrant. More importantly, many of the internet’s largest economic winners were simply businesses that learned to use the technology more effectively than their competitors.

    The same dynamic may unfold with artificial intelligence. Today’s AI developers understandably receive most of the attention, but tomorrow’s biggest winners may instead be companies that deploy AI to automate operations, improve customer experiences, reduce costs, or accelerate scientific discovery. Pharmaceutical firms discovering breakthrough drugs, manufacturers optimizing production, and financial firms improving productivity may ultimately generate greater shareholder value than some of the companies building the underlying technology.

    Artificial intelligence is a revolution that stands to change society as profoundly as the internet before it. Still, many of that era’s pioneers have come and gone. Whether the anticipated public debuts of leaders like Anthropic and OpenAI ultimately reward long-term shareholders remains, as always, an open question.

    Successful investing does not depend on identifying the next headline-grabbing IPO or predicting a revolution’s winners with concentrated bets. History continues to support a disciplined approach built on broad diversification, thoughtful asset allocation, tax efficiency, and long-term ownership of exceptional businesses.

    THIS QUARTER’S WINNER

    This quarter’s best-performing asset class was one many investors overlook entirely: Emerging Markets.

    Two of the largest countries within Emerging Markets—Taiwan and South Korea—have become indispensable participants in the global AI revolution. From advanced semiconductor manufacturing to memory chips and critical hardware infrastructure, these economies sit at the center of the technology supply chain powering artificial intelligence worldwide.

    Last year, a meaningful portion of international outperformance resulted from a declining U.S. dollar. This quarter, however, geopolitical uncertainty surrounding the conflict with Iran has strengthened the dollar as investors sought traditional safe-haven assets. Despite that currency headwind, Emerging Markets continued to produce exceptional returns.

    Year-to-date, Emerging Markets have appreciated more than 20%, another reminder of why we advocate globally diversified portfolios. While the U.S. market remains near all-time highs, leadership within global markets continually rotates, and no one can consistently predict which region will lead next.

    Diversification is not simply about reducing risk. Increasingly, it is proving to be a powerful source of longterm investment returns.


    By Miriam Gottfried & Peter Santilli
    May 16, 2026 at 7:00 pm ET

    With the stock market near record highs, it isn’t enough to be winning anymore. Wealthy investors are now obsessed with losing, too.

    The hottest investment on Wall Street promises a magical-sounding mix of both: Index-beating performance that also comes with losses to off set capital gains taxes.

    Millions of investors are sitting on big gains in concentrated stockholdings, be they shares of Magnificent Seven tech giants, plain-vanilla index funds or employee shares of hot tech companies.

    The traditional move would be to turn to direct indexing, a form of tax-loss harvesting that has been an investing mainstay since the early 2000s. There is now $1.1 trillion invested in that strategy, according to research firm Cerulli Associates.

    But for many investors who have ridden this ebullient stock market, direct indexing is no longer generating the losses it once did.

    So financial advisers are trying to turn up more losses for their clients by employing strategies that use leverage. Over $150 billion has flowed into this newer breed of tax-loss harvesting, known as long-short tax-aware, or tax-aware alpha, according to Brent Sullivan, who writes about the industry on his Substack, Tax Alpha Insider.

    The strategy comes with some risks for investors.

    If the S&P 500 is up 15% for the year, the goal is for the client’s portfolio to rise that much, while also distributing losses. These losses could be used to offset gains in highly appreciated securities elsewhere in the portfolio.

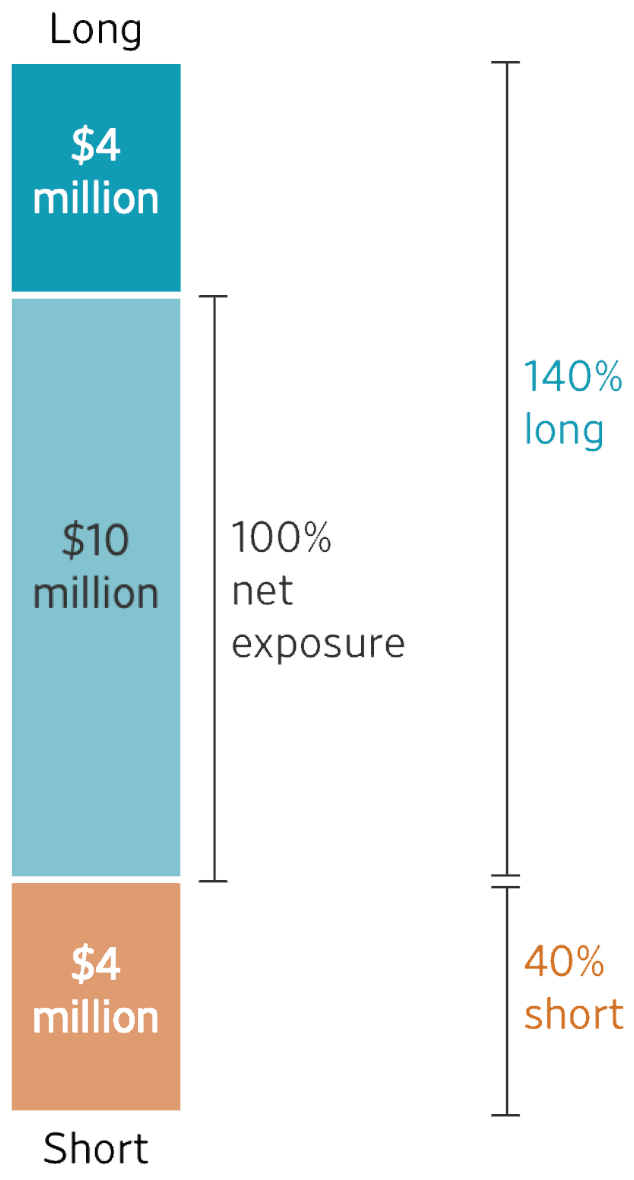
    An investor with $10 million would go to a long-short manager who would invest the money in a basket of stocks. But they would also
    borrow against the investment to create two “extensions,” longs that bet on the stocks and shorts that bet against them.

    In a 140-40 portfolio, for example, the manager would be going long and short by an additional $4 million, respectively.

    The investment is now 140% long and 40% short, which can amplify returns, while providing more opportunities for tax losses to harvest.

    The investor’s net exposure would still be $10 million, or 100% net long.

    The leverage amplifies both the losses and the gains relative to the investor’s overall position. It also generates losses on the shorts that go up in addition to the longs that go down, so there is greater potential for losses to harvest.

    But direct indexing gradually loses steam as a method of generating losses as the market continues to rise. Around half of such portfolios industrywide are now “ossified,” meaning they are no longer generating losses, estimates Jon Diorio, head of U.S. wealth product at BlackRock.

    A new strategy took shape. Hedgefund firm AQR Capital Management developed the tax-aware long-short strategy for clients such as family offices and ultrawealthy individuals. Around five years ago, the firm and its rival, Quantinno Capital Management, began allowing individual investors and their advisers to tailor the strategy inside their own separately managed accounts, or SMAs.

    Custodians, most notably Fidelity Investments, made the strategy accessible by lowering the investment minimums. It was a hit. AQR now manages nearly $70 billion in taxaware long-short strategies, roughly 80% of which is in SMAs. Quantinno manages more than $48 billion. They have spawned numerous imitators.

    Long-short managers generally aim for “alpha,” meaning they want to outperform the benchmark in addition to harvesting losses. The strategy must balance these aims.

    The strategy has become so popular that Fidelity and Charles Schwab have recently instituted limits on new accounts.

    Both strategies come with risks. Direct-indexing managers might not succeed in tracking the index if they can’t find appropriate substitutes for the stocks they sell. The Internal Revenue Service’s “wash sale” rule limits the ability to recognize a loss on the sale of stock if the same stock is purchased within 30 days before or after the sale.

    But holding on to the winners means new gains can build up over time within the strategy. Investors must eventually pay taxes on these if they cash out.

    Michael Paulus, founder of wealth manager PCM Encore, recommends direct indexing for nearly all his clients, particularly those close to retirement who will need to sell highly appreciated stocks to fund it. Direct-indexing managers charge annual fees as low as 0.05%.

    But he is more cautious about using long-short SMAs. He has used them for clients expecting a major onetime gain such as from the sale of a business or for clients who work in tech and get a large portion of their pay in stock. He otherwise avoids them.

    Tax-aware long-short strategies can cost as much as 1.5% to 3%, including investment management, financing and borrowing fees.

    “All else being equal, I’d probably rather cut the government a check than a hedge fund in Connecticut,” Paulus said.

    Neither direct indexing nor longshort SMAs are likely to eliminate all capital gains in a bull market like this one. The losses they generate are often used to offset gains in other areas of the portfolio. For example, someone selling a stake in a business at the beginning of the year could invest the money into a long-short SMA to generate losses to offset some of their capital gains by the end of the year.


    Disclosures: Past performance is no guarantee of future results.
    1: Dimensional – Do IPOs Have a Place in Your Portfolio? September 2025

  • 1st Quarter 2026

    OUR QUARTERLY NEWSLETTER TO CLIENTS AND FRIENDS OF THE FIRM

    FIRST QUARTER 2026


    Energy Shocks & Market Resilience

    War is among the most devastating forces humanity experiences. Yet history shows us that even in the shadow of conflict, society rebuilds, innovation continues, and economic progress resumes often sooner than many expect.

    The first quarter of 2026 offered investors another familiar reminder: markets are noisy but resilient. Since the conflict with Iran began, growth has moderated, inflation has risen, and while recent signals suggest an end may be near, risks remain.

    The most tangible risk of the current conflict involving Iran is through energy prices, which ripple across transportation, manufacturing, and consumer goods. If you’ve filled your car with gasoline recently, you’ve felt the rise in energy costs firsthand. Even so, futures markets suggest the spike in oil prices may be temporary. Contracts expiring as soon as next year are trading under $70 a barrel, down from a high of $112.95 on April 7th, indicating that market participants expect energy prices to normalize over time.1

    Despite these pressures, equity markets have recovered from their short-lived drawdown earlier this year, and many clients have been pleasantly surprised by their Q1 results. While US tech companies have ceded their spot as top performers, international and emerging markets delivered strong results and our alternative investments provided measurable diversification benefits during a period of uncertainty. This reinforces a core principle: long-term success rarely depends on identifying a single winner, but rather on maintaining exposure to many sources of return.

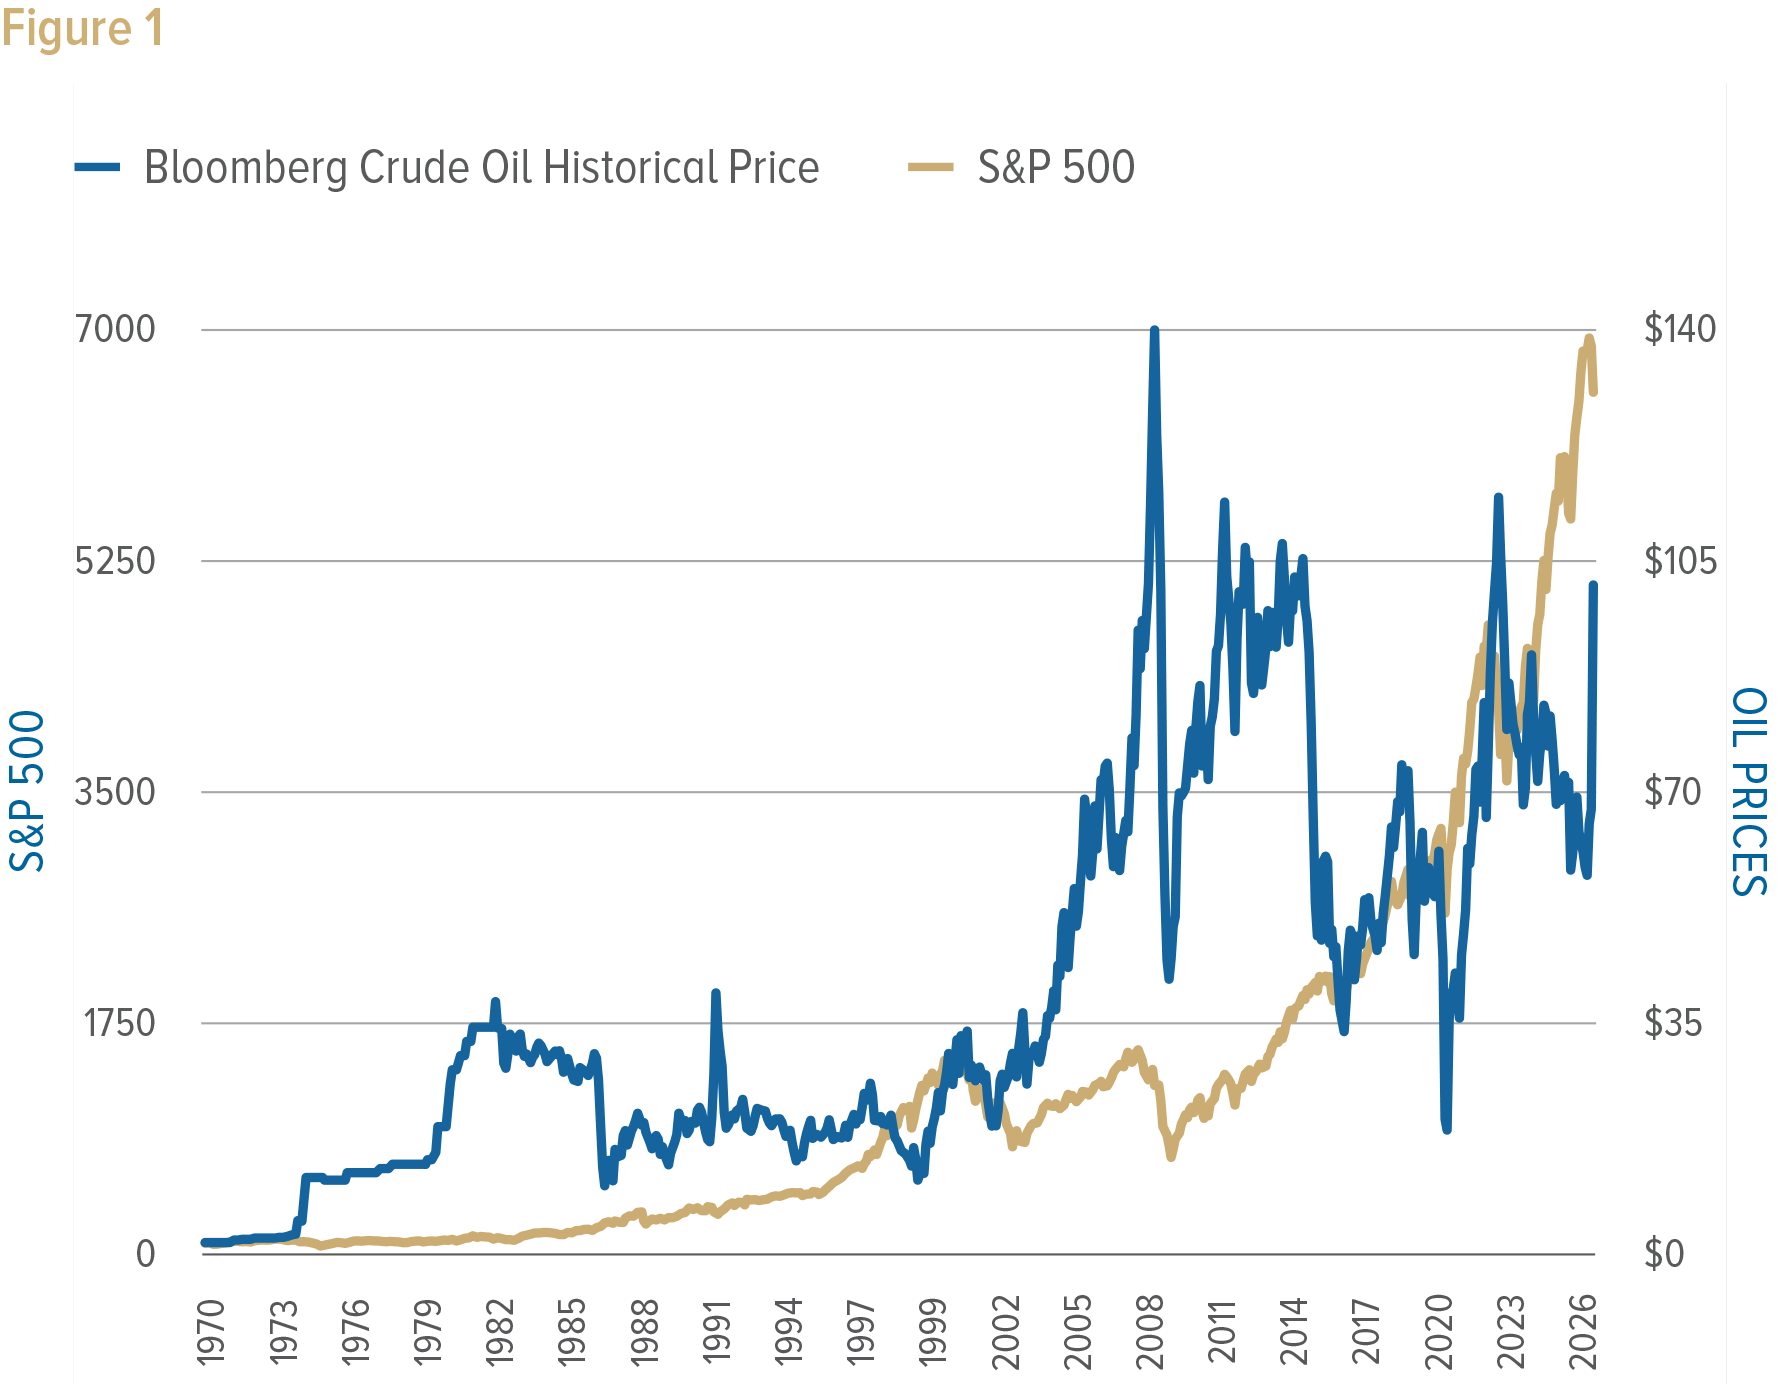
    The relationship between oil prices and stock returns is less intuitive than it seems: despite repeated oil price surges over the past 50 years, the data shows no consistent pattern of weak stock returns in the periods that followed. Figure 1 illustrates this by showing the returns of the S&P 500 Index compared to the price of oil over time. Rather than being coupled to the price of oil, the stock market relies more on total economic growth.

    Technology remains a key driver of that growth. Artificial intelligence is reshaping industries from healthcare to manufacturing, and the opportunity extends well beyond a handful of high-profile companies. The expansion of the broader infrastructure of data centers, semiconductors, power generation, and network capacity continues to drive growth both at home and abroad.

    As we move further into 2026, the landscape appears neither euphoric nor fragile. Growth is steady, corporate earnings continue to expand, and interest rates are supportive without being artificially low. These conditions may lack drama, but they provide a durable foundation for long-term investors.

    Our commitment remains unchanged: thoughtful planning and portfolio management, clear communication, and disciplined focus on the principles that have guided successful investing for generations: diversification, patience, and perspective.

    PRIVATE CREDIT
    VS. THE PRESS

    Recent headlines have drawn comparisons between today’s private credit markets and 2008. Those comparisons may garner attention, but they aren’t supported by the facts. The current environment reflects adjustment, not crisis.

    Private credit is central to the U.S. economy. Middle-market companies, the primary borrowers, number roughly 230,000 firms and employ about 40 million people, nearly one-third of all U.S. corporate employment. This is a foundational source of business investment and job creation, not a peripheral corner of finance.

    Much of the concern centers on software companies, which represent about 24% of the private credit market, and their vulnerability to AI disruption.2 Yet many of these businesses operate on long-term contracts with recurring revenue, meaning any performance adjustments are likely to unfold gradually rather than suddenly.

    Redemption gates, or predefined limits on investor withdrawals, have also drawn scrutiny. Rather than being warning signs, these limits are prudent risk-management tools that prevent forced asset sales and protect portfolio value for all investors. Risk in this asset class is best measured by default rates, not headlines. Current credit losses sit at approximately 2.5% per year, broadly in line with historical norms3.

    Risks will always exist in investing. Although vigilance is warranted, the evidence today is clear: current default rates are far from concerning, liquidity is available, and private credit markets are functioning as designed. Rather than running for the hills, we’ll continue to closely monitor these assets and evaluate opportunities in the context of your entire portfolio.

    Disclosures: Past performance is no guarantee of future results.
    1: US Crude WTI Future September 2027 contract valued at $69.74 as of 4/17/26 and historical price of the contract on 4/7/26. 2: JPM IB North American Credit Research, Proskauer, Latest as of March 2026. 3: Wall Street Journal, Private Credit’s Exposure to Ailing Software Industry Is Bigger Than Advertised 3/29/26. Figure 1: For illustrative purposes only. Data sourced from Bloomberg. Chart compares the Bloomberg Crude Oil Historical Price Index to the S&P 500 Index, monthly from 1/1/70-3/31/26.​


    International Monetary Fund

    By Tobias Adrian

    Global financial markets entered 2026 from a position of strength. Asset prices rose across major markets, volatility was subdued, and financial conditions were easy by historical standards. That benign backdrop has now been tested by the war in the Middle East.

    So far, markets have absorbed the shock with a degree of resilience. While the decline in asset prices has been significant, market functioning has been orderly. Nonetheless, this resilience should not be taken at face value. Rather, it reflects cycles of escalation and de‑escalation, structural improvements in the financial system, and the absence of a decisive adverse turn that would trigger sustained market drawdowns.

    Global markets reacted swiftly following the outbreak of hostilities. Equity prices declined, sovereign bond yields rose, and volatility increased across asset classes, reflecting higher energy prices and renewed inflation uncertainty. Importantly, this adjustment was reasonably orderly, without signs of acute liquidity stress or funding problems among financial institutions and investors. In fact, this price‑based absorption of shocks is a key feature of resilient markets. It facilitates risk sharing across investors and preserves price discovery critical for efficient capital allocation. So far, short‑term funding markets and core market infrastructures have helped facilitate the repricing of assets.

    Financial conditions have tightened since the onset of the conflict, but they remain far from the stress levels observed during past episodes of global turmoil. Compared with earlier crises, there is still a considerable margin of safety. At the same time, the relatively modest adjustment to date also indicates that markets have not fully priced adverse scenarios.

    The main channel through which the conflict has affected markets has been via inflation expectations. Higher energy prices have pushed breakeven inflation rates and yields up across advanced and emerging economies. Yield curves have flattened, with short‑term rates rising more than long‑term rates. This highlights the difficult environment facing central banks. With near‑term inflation risks having risen substantially, monetary policy must remain focused on price stability. On the other hand, the longer the war continues, the more damaging it is to economic growth and labor markets—the flattening of the yield curve, should it continue, could be a sign of this. In this environment, clear communication, credibility, institutional independence, and timely tightening when warranted are essential to anchoring expectations.

    Higher yields have renewed focus on public debt risks. Many advanced economies are entering this episode with elevated debt levels and limited fiscal space. Together with changes in the investor base—away from central banks and toward price‑sensitive nonbank investors—sovereign yields may respond more forcefully to inflation shocks than in the past.

    Emerging markets are more sensitive to these changes. Elevated pre‑shock valuations and the growing dominance of debt portfolio flows and carry‑trade strategies have increased exposure to global risk sentiment. While resilience has improved over the past decade in many countries, vulnerabilities remain pronounced in those with high external financing needs or volatile investor bases.

    The key financial stability risks do not lie in the initial shock itself, but in amplification channels that could turn market volatility and sell-offs into more acute stress. Elevated leverage in parts of the nonbank financial sector, increased concentration in equity markets, and historically tight credit spreads all raise the potential for abrupt forced-selling and sudden liquidity strains through margin and collateral calls.

    Private credit is an important area of focus. Rapid growth in direct lending has made the sector more important to the overall economy and financial system, while opacity, valuation practices, short‑term funding backed by longer‑term assets, and rising defaults pose challenges. While these vulnerabilities have not yet been tested by an adverse shock, their presence means that the system is more exposed, even if markets have remained orderly so far.

    In addition to monetary policy, other key policy areas also have uneven space to act. Fiscal policy is limited by high debt and persistent deficits. By contrast, financial stability policy is less constrained. Central banks have reduced their balance sheets, freeing some capacity for asset purchases if needed, and crisis‑management frameworks and liquidity backstops are stronger than in the past. Targeted prudential measures, robust supervision, effective stress testing, and well‑designed liquidity tools can also be deployed.

    The experience of recent months underscores that resilience should not be inferred from the absence of stress. Elevated asset prices, intact risk‑taking incentives, and stronger amplification channels mean that risks remain skewed to the downside—even if markets have adjusted in an orderly manner so far.

    The task for policymakers is therefore not to predict the next shock, but to ensure that vulnerabilities are mitigated and the system remains capable of absorbing stress without amplifying it. Amid recurring supply shocks and heightened geopolitical uncertainty, financial stability cannot be taken for granted—it must be actively protected.


    This blog is based on Chapter 1 of the April 2026 Global Financial Stability Report, “Global Financial Markets Confront the War in the Middle East and Amplification Risks.”

  • 4th Quarter 2025

    OUR QUARTERLY NEWSLETTER TO CLIENTS AND FRIENDS OF THE FIRM

    FOURTH QUARTER 2025


    2025 Year in Review

    It’s that time of year when we reflect on the dynamics that shaped last year’s investment performance and evaluate the implications for our portfolio as we move forward. Last year was marked by double-digit returns across numerous asset classes in an inflationary environment that is getting back to “normal.” We recommend logging into your client portal to see how your portfolio has performed.

    KEY TAKEAWAYS

    Emerging Markets led the charge with a staggering 34% return. Before last year, these countries struggled to recover from COVID, but they came roaring back. This remarkable rebound was fueled by rising commodity prices and increasing consumer demand, but also by a flagging dollar. When the U.S. dollar weakens, international stock funds often benefit because foreign earnings translate into more dollars, boosting returns for U.S.-based investors.

    Following closely behind, the international index’s 31.5% return reflects the broader recoveries occurring within global markets, driven largely by economic policy, improved economic sentiment, heightened consumer confidence, and again the weakening dollar.

    In the U.S., the Russell 3000 index posted a welcome 17% return, showcasing the enduring strength of the American economy. However, caution is warranted. Public investments, particularly in the U.S., have recently exhibited a tendency to inflate significantly, occasionally detaching from the reality of their earnings. This discrepancy presents a challenge for discerning investors, reinforcing the need for thorough analysis and strategic selections within our US equity allocations.

    In an environment characterized by volatility, alternatives proved their worth with an impressive 8.6% return. Their inherent ability to provide diversification and risk mitigation remained essential, particularly against the backdrop of fluctuating markets.

    Furthermore, the solid performance of global real estate, achieving an 8.6% return, demonstrates the resiliency of this asset class. An exciting development within this market segment is the emergence of data centers springing up around the country, driven by the increasing demand for data and computing power from AI. We continue to advocate for strategic allocations to real estate, underlining its critical role in maintaining portfolio stability.

    Similar to last year, private bonds in general delivered strong returns, outperforming their public investment-grade counterparts. However, for private real estate and private equity, returns being based off of “fair value” have resulted in more muted outcomes compared to public peers. As we have observed in previous years, private investments are often assessed based on real cash flows and third-party valuations, sometimes resulting in steadier, less extreme returns.

    The good news for bonds continues, as they recover from the not so “transitory” inflation shock of 2022. The U.S. Aggregate Bond Index delivered a return of 7.2%, indicating that fixed-income investments remain an important aspect of overall portfolio balance, providing a necessary ballast that we will undoubtedly need again in the future. All the asset class returns, particularly bonds, should be viewed in the context of 2.7% inflation. This return above inflation is know as the “real return,” which drives wealth creation and growth within the portfolio. For our low-risk investments to deliver at this level above inflation is a welcome reprieve from the decade of low interest rates prior to 2022.

    Following 2024’s strong performance, it’s essential to remember that the U.S. has experienced elevated returns similar to what we observed this past year throughout the last century. These periods known as the Roaring ’20s, the Nifty Fifty, and the Internet Bubble serve as notable markers in investment history. It remains to be seen whether the current AI investment trend will earn its own claim to fame or infamy in the coming years.

    As we contemplate the year ahead, we remain vigilant and prepared for potential market fluctuations. The past year has underscored the ongoing importance of a disciplined investment strategy along with diverse allocations. While much of the conversation currently centers around advancements in AI and its market implications, prudent investing remains paramount. The lessons from history ring true: after periods of well-above-average returns, there is frequently a reckoning. Piling into risk assets may be tempting, but a well-structured, diversified portfolio equipped to weather economic fluctuations is key to achieving long-term investment success.

    Thank you for your continued partnership and trust in Ariadne Wealth. Together, let’s prepare for the opportunities and challenges that 2026 will bring.

    Disclosures: Past performance is no guarantee of future results.
    Figure 1: Indices are not available for direct investment. Total returns calculated from 1/1/2025-12/31/2025, except for inflation which is calculated for the 12 months ending 11/30/2025. US Stocks = Russell 3000 Index. Int’l Stocks = MSCI EAFE Index. EM Stocks = MSCI Emerging Markets Index. Global RE = Dow Jones Global Select Real Estate Securities Index. Bonds = Bloomberg U.S. Aggregate Bond Index. Inflation = Consumer Price Index for All Urban Consumers. Alternatives = 25%/25%/50% combination of ASFYX/AQMIX/QSPIX’s calendar year total return.


    The Wall Street Journal

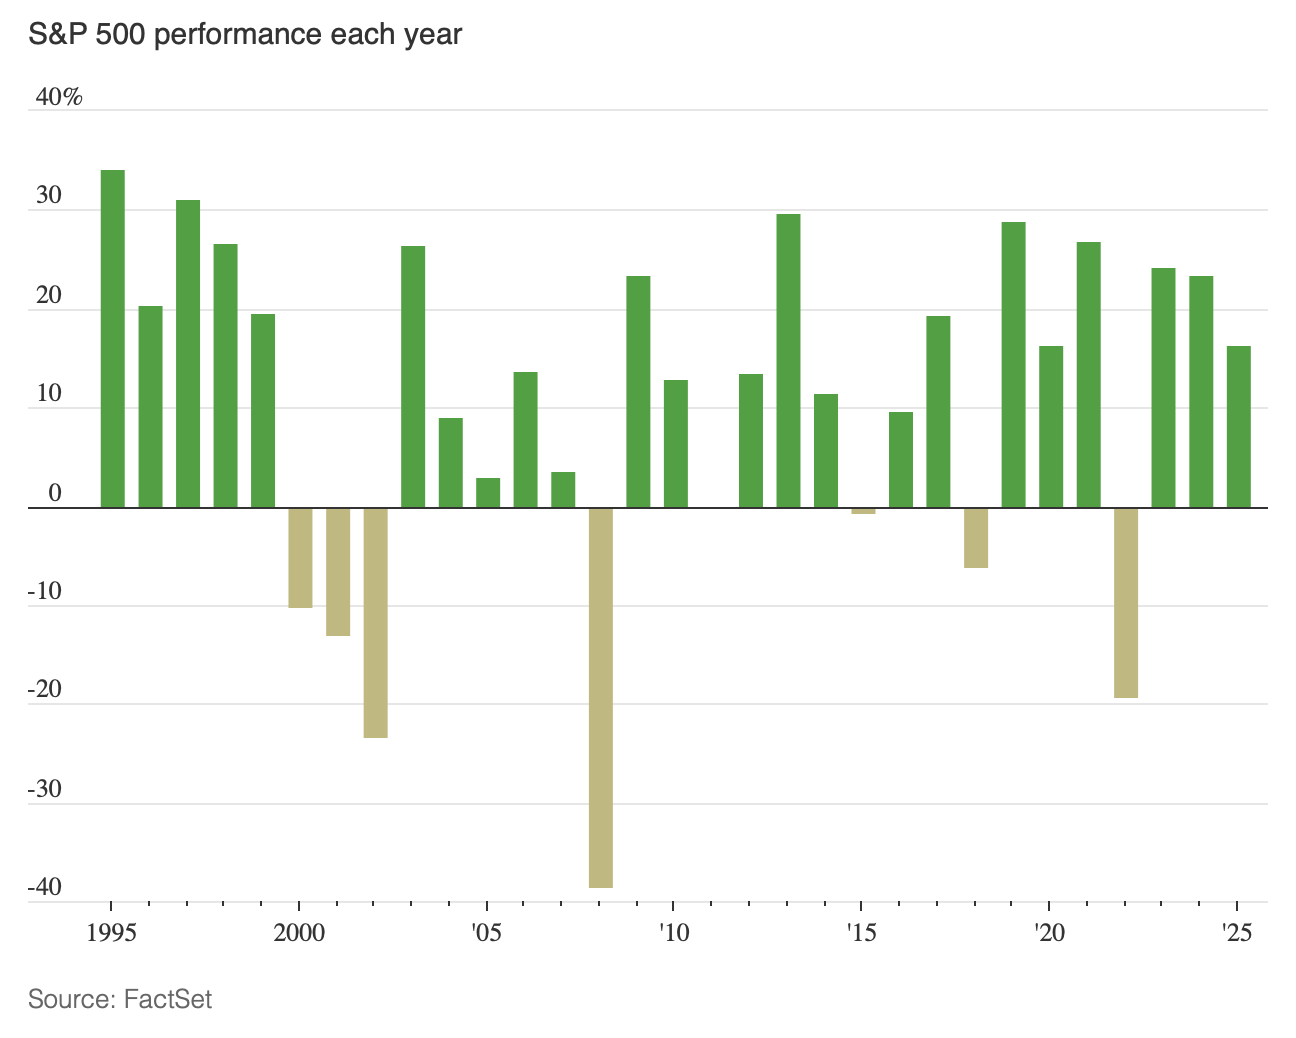
    Corporate profits and falling interest rates may be enough to lift the S&P 500 to a fourth-straight year of gains, the longest such streak in nearly two decades

    By Krystal Hur
    Jan. 3, 2026 at 9:00 pm ET

    Wall Street is betting that falling interest rates and strong corporate earnings will be enough to eke out yet one more year of stock-market gains. It’s going to be close.

    After posting double-digit percentage increases for three straight years, from 2023 through 2025, the S&P 500 and other major U.S. indexes enter year four of their rally with stretched valuations on many big stocks and a cloudier economic picture. There are enough positives to give investors and analysts hope, but some worry there isn’t enough to keep up the pace of 2025.

    “We probably have an OK market, but certainly not what we’ve seen in the last couple years,” said Mark Hackett, chief market strategist at Nationwide.

    The S&P 500 surged 16% last year, with a resilient economy, renewed interest-rate cuts and artificial-intelligence fervor propelling the benchmark index to 39 records. The Dow Jones Industrial Average gained 13% while the Nasdaq composite jumped 20%.

    Wall Street analysts and strategists have predicted the party will continue in 2026. Bank of America expects the S&P 500 to reach 7,100 by the end of this year, a 3.7% gain from the 2025 closing level. JPMorgan Chase and Goldman Sachs expect the benchmark index to reach 7,500 and 7,600, respectively.

    Their bullishness, in light of the past gains, is reason enough to be cautious, some investors said. The S&P 500 surged roughly 80% from the start of 2023 through New Year’s Eve, a torrid pace that will be hard to maintain under most circumstances, they said.

    “It behooves investors to at least offer a little skepticism when there is such a broad consensus that everything will go well,” said Steve Sosnick, chief strategist at Interactive Brokers.

    The current rally is getting old, at least compared with past market cycles. Should the S&P 500 rise in 2026 for a fourth-consecutive year, it would be the longest such streak since 2007, when the benchmark completed a five-year run. In the index’s history, there have only been five streaks of four or more consecutive years of gains, according to Dow Jones Market Data.

    In the coming days, investors will get their next look at the economy’s health from the December jobs report. Companies will also begin reporting earnings soon, with results from big banks including JPMorgan Chase, Wells Fargo and Citigroup due in the next few weeks.

    The 2025 rally swept across more than just stocks. Gold and silver had their best year since 1979, while bonds saw their best showing since 2020. A fresh wave of speculation among individual investors spawned a new class of meme stocks and helped drive options trading volumes to records again.

    One expected boon for the market this year is lower interest rates. The Federal Reserve penciled in one quarter-point cut for this year, and some expect that President Trump’s pick for the next Fed chair after Jerome Powell’s term expires in May will lean more dovish. Tax cuts are also poised to boost corporate coffers.

    Yet, there are also signs that prices have run up too far, too fast. The price of bitcoin finished last year below $88,000 after sliding more than 30% from its record above$126,000 set in early October. Many of the meme stocks that saw huge swings higher have come down just as quickly. 

    Some analysts are also concerned that the huge gains in artificial-intelligence stocks, which have fueled much of the market’s gains over the past three years, have limited room to run further. While many believe that AI will be a transformative technology for the economy, they fret that the promised returns on multibillion-dollar investments between the major AI players will be difficult to realize, potentially weighing on future gains.

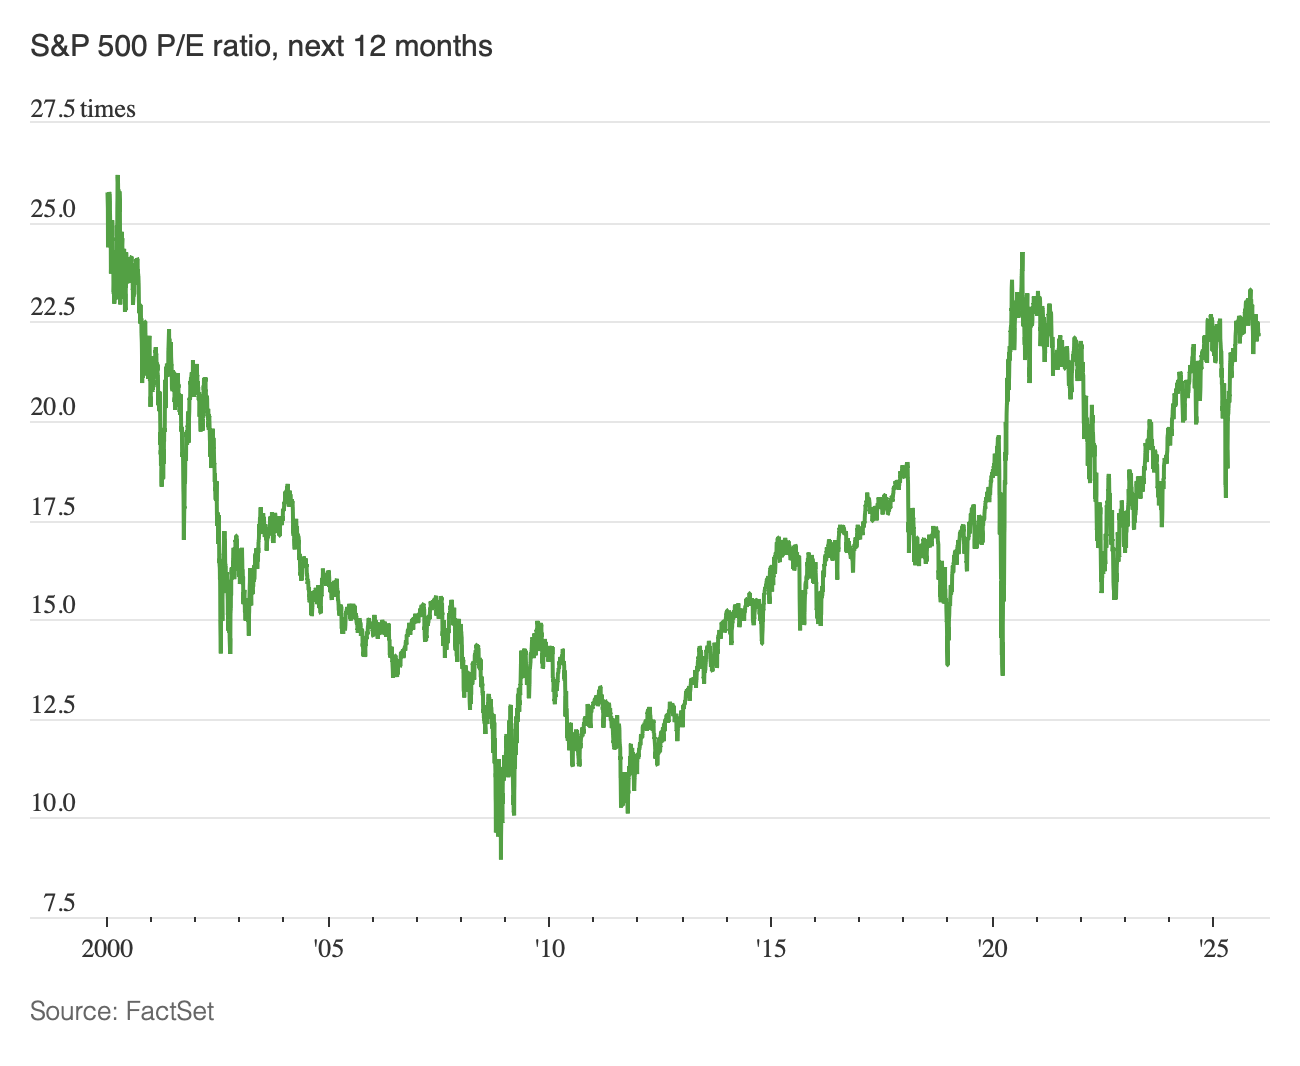
    Stock valuations are looking rich, too. Companies in the S&P 500 are trading at 22 times their expected earnings over the next 12 months, above their 10-year average of 19 times. Around half of the valuation metrics for the S&P 500 tracked by Bank of America are higher than levels seen in March 2000, near when the dot-com bubble burst.

    Many expect that the economy will continue to hold up and provide fresh fuel for the stock rally. The U.S. economy remained resilient last year despite Trump’s tariffs, persistent inflation and immigration shocks, with Americans continuing to spend and businesses continuing to invest mammoth amounts in data centers and other critical parts of AI infrastructure.

    Corporate earnings growth is expected to remain robust. Analysts polled by FactSet expect companies in the S&P 500 to report a 15% jump in profits this year, which would mark the highest annual rate of growth since 2021.

    “The base case is one in which there is sufficient momentum in the economy,” said Mark Luschini, chief investment strategist at Janney Capital Management.

  • 3rd Quarter 2025

    OUR QUARTERLY NEWSLETTER TO CLIENTS AND FRIENDS OF THE FIRM

    THIRD QUARTER 2025


    Bonds Are Back

    For more than a decade, fixed income investors faced a sobering reality: yields on high-quality bonds were persistently low. In the wake of the 2008 financial crisis, central banks across the globe, including our own Federal Reserve, slashed interest rates to near-zero levels in an effort to stimulate economic growth. The result was an era of ultra-low interest rates that left bond investors with few attractive options.

    Diversified portfolios, especially those built on the very basic 60/40 stock-bond model, faced muted returns from the bond side. For many, bonds became less about income and more about ballast—something to hold during equity drawdowns but not to drive returns.

    But that narrative is changing—and fast.

    The dramatic rise in interest rates over the last two years has been one of the most important (and underappreciated) developments in capital markets. Triggered by a post-COVID surge in inflation, the Federal Reserve embarked on its most aggressive tightening cycle in 40 years. From March 2022 through late 2023, the Fed Funds rate jumped from 0.25% to over 5%, sending shockwaves across investments of all types.

    This reset was painful in the short term, 2022 was the worst year for bonds in modern history, but it has laid the groundwork for a vastly improved forward-looking return profile. That story has been quietly playing out in 2025.

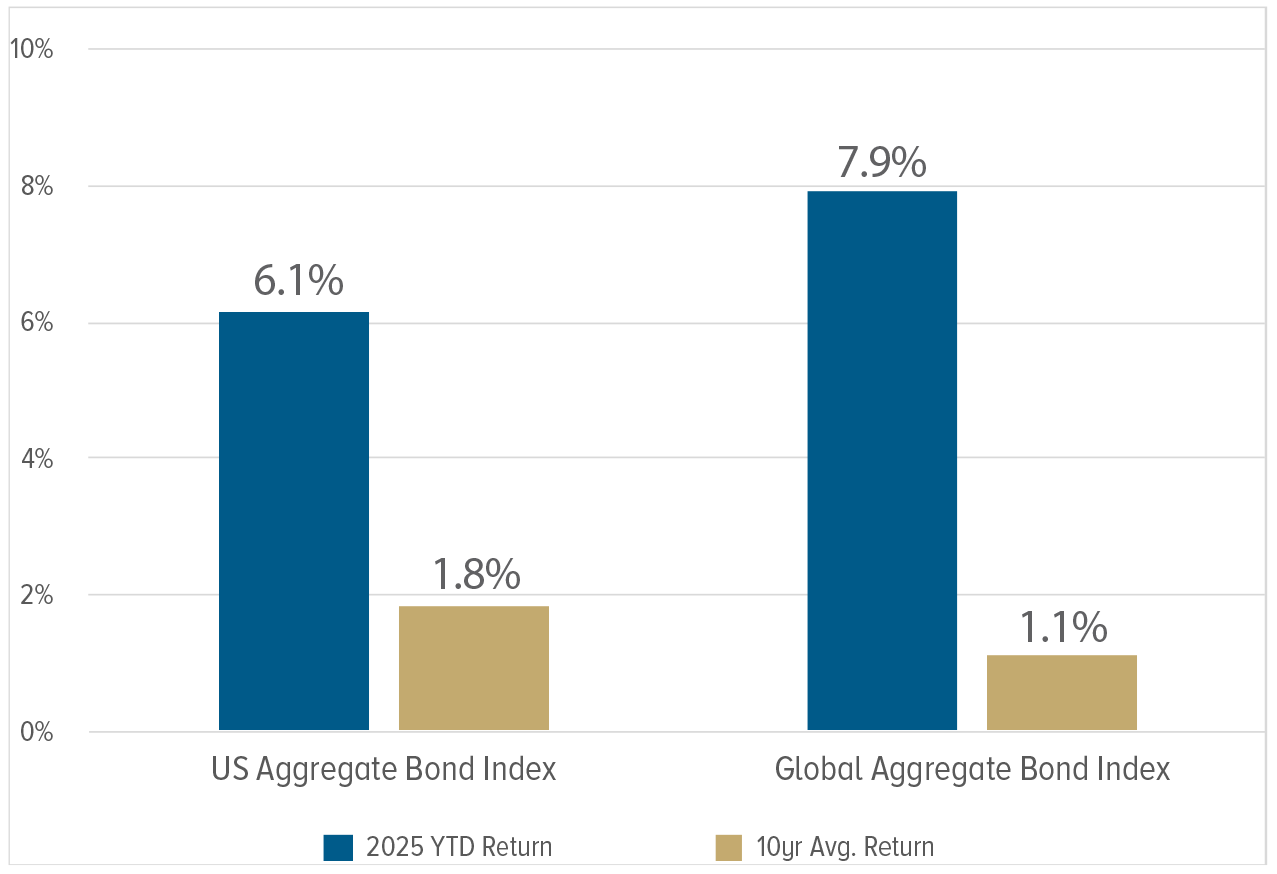
    Figure 1

    The chart in Figure 1 tells a powerful story. Through the first three quarters of 2025, the U.S. Aggregate Bond Index has climbed 6.1%, while the Global Aggregate Bond Index has delivered an impressive 7.9%. If current momentum continues, 2025 is on track to be the strongest year for bond returns in over a decade. This marks a dramatic departure from the subdued performance of the past ten years, when yields on high-quality bonds hovered at 1-2% annually.

    Despite these impressive numbers, this shift in the bond market has been largely overlooked in the financial press. That’s unfortunate—because for the thoughtful, diversified investor, this is very good news.

    Higher interest rates have restored the ability of fixed income to contribute meaningfully to overall portfolio returns without requiring excessive credit or term risk.

    Importantly, these returns are not dependent on strong equity markets or economic surprises. They are driven by yield, the most reliable and contractual component of total return.

    Some may wonder if this opportunity has passed, especially now that the Fed has begun cutting interest rates. Even as yields modestly decline, they remain well above the recent past. The income earned on today’s bond portfolios continues to compound at attractive rates, and reinvestment risk has been manageable given the flatter trajectory of future rate cuts.

    There’s a quiet but meaningful tailwind supporting globally diversified investors: the U.S. dollar is weakening. After years of strength, the dollar is now under pressure as markets begin to anticipate lower interest rates and rising fiscal challenges. For U.S.-based bond investors with international exposure, this shift matters. When the dollar weakens, foreign bonds—denominated in local currencies—gain value when converted back into dollars, boosting returns. This currency effect has been a significant contributor to global bond performance. All things considered, 2025 has marked a clear turning point—bonds are officially back.

    Gold at All-Time Highs:
    Should It Have a Place in Your Portfolio?

    With gold recently reaching new all-time highs, it’s natural for investors to wonder whether the yellow metal deserves a place in a modern, diversified portfolio. While gold can act as a temporary safe haven during periods of market uncertainty or geopolitical stress, the long-term data suggests that its role in strategic asset allocation is limited, especially for growth-oriented investors.

    Since the early 1970s, when gold was decoupled from the U.S. dollar, its returns have lagged well behind the U.S. stock market. Stocks represent productive assets: businesses that generate earnings, pay dividends, and grow with the economy. Gold, by contrast, is inert. It doesn’t generate cash flows, and its value is largely sentiment-driven.

    Although we don’t invest in gold itself, our managed futures strategies do capitalize on price trends in gold as well as dozens of other assets. This approach to commodity investing allows investors to benefit from gold’s momentum while maintaining a more flexible and risk-managed portfolio.

    In short, while the headlines may tempt you, gold’s recent rally is not a reason to deviate from a disciplined, evidence-based investment strategy. We continue to believe that a globally diversified portfolio offers the best path to long-term financial success.

    Disclosures: Past performance is no guarantee of future results. For illustrative purposes only.

    The Wall Street Journal
    The U.S. currency’s rise and fall from prominence in the early 20th century offers
    lessons for today’s political leaders.

    By Barry Eichengreen
    Sept. 11, 2025 at 10:00 am ET

    Is the U.S. dollar’s position as the world’s reserve currency on shaky ground?

    Some people think so, pointing to President Trump’s tariffs, America’s growing debt and its use of financial sanctions as a foreign-policy tool. Russia, barred from using the dollar in 2022, has shifted to using the Chinese renminbi for its international transactions. Other countries are exploring alternatives, as well, amid concerns that America’s outsize engagement in the global economy could end and debt will force the Federal Reserve to keep policy rates low, fueling inflation and dollar depreciation.

    To many others, however, such claims seem far-fetched. The very fact that the U.S. currency is so widely used, and that the U.S. economy is so large, means its international role is secure.

    But those espousing this Panglossian perspective forget that the dollar lost its primacy once before. It is a story worth retelling.

    The dollar’s rise

    The dollar wasn’t used internationally at all before World War I, when Britain’s pound sterling was the world’s currency. U.S. banks weren’t permitted to branch abroad and America had no central bank to backstop its financial markets.

    That changed following passage of the Federal Reserve Act in 1913, which created that central bank and permitted American commercial banks to branch overseas.

    The Fed’s founders, who needed to overcome Americans’ deep-seated aversion to concentrated financial power, had various motivations for wanting to create a new U.S. banking system. Carter Glass of Virginia, the crusty, self-styled financial expert in the U.S. House and co-sponsor of the Glass-Owen Federal Reserve bill, sought a decentralized system of public banks to provide credit to financially underserved Southerners. Nelson Aldrichof Rhode Island, influential chairman of the Senate Finance Committee, wanted a European style central bank, along the lines of
    the Bank of England or the German Reichsbank, to mitigate financial crises.

    For Paul Warburg, the cerebral, mustachioed German-American banker and one of the country’s most influential financial commentators, America’s dependence on sterling was a competitive disadvantage because it forced U.S. exporters to source trade credit abroad and shoulder exchange rate risk. Warburg lobbied for a central bank to make a market in dollar trade credits, essentially short-term IOUs that function as a promise of future payment. Warburg’s bank would stand ready to buy those credits, known as trade acceptances, at a preset price, making their cost and availability steady and predictable and allowing U.S. importers and exporters to use the dollar to finance their trade.

    Warburg’s vision became reality when he accompanied Aldrich to a secret meeting in 1910 on Jekyll Island, off the coast of Georgia, where a group of prominent bankers hammered out the essentials of the Federal Reserve Act. President Woodrow Wilson appointed Warburg to the Federal Reserve Board, a perch from which he encouraged the Fed to support the nascent dollar credit market. Warburg advocated relaxing restrictions on the types of credits the Fed could purchase or discount, giving the central bank a role in financing not just merchandise trade, but purely financial transactions such as short-term loans and then dollar acceptances originated by foreign banks, as well. To further promote the market, Warburg in 1919 founded the American Acceptance Council to be a policy advocate for the industry.

    In 1921, he formed the International Acceptance Bank, under whose umbrella a consortium of banks provided dollar finance for foreign trade.

    By the late 1920s, largely through the efforts of this one man, New York had become the leading source of trade credit, and the dollar had supplanted sterling as the leading international currency. To be sure, Warburg’s efforts were supported by favorable structural conditions. The U.S. was the single largest economy from 1880. It became the leading national exporter in 1913. After World War I it had the largest financial markets, and it was the leading source of foreign loans. Thus, there was nothing paradoxical about the dollar’s rise—other than how long it had taken to get there.

    The dollar’s fall

    But what was gained could equally be lost. Starting in 1929, with the onset of the Great Depression, U.S. imports and exports fell. The Smoot-Hawley Tariff and the foreign retaliation that followed dealt trade another blow.

    Three devastating financial crises disrupted the flow of finance and discouraged importers and exporters from relying on the U.S. banking system.

    At this time, a third of all outstanding dollar acceptance paper held by U.S. banks and the Federal Reserve had originated abroad, mostly in Germany. In the aftermath of hyper inflation in 1922-23, the German public remained understandably reluctant to entrust its savings to domestic banks. Those cash-strapped banks lent to German importers and exporters only at double-digit interest rates. American banks, flush with funds and finding those rates irresistible, provided trade credit to German banks, which passed it on to German firms. The dollar acceptance market was now underwriting the transactions of foreign, as well as American, merchants and producers, signifying the U.S. dollar’s greatly expanded international role.

    It all came tumbling down when distressed U.S. banks stopped lending. The German government responded with a moratorium on the country’s debts, including its acceptance credits. U.S. banks, including the Federal Reserve Banks, were left holding the bag. That is to say, they were left holding potentially worthless foreign acceptance paper.

    The Fed refused to step in and sustain the market, compounding the problem. The sharp decline in the share of dollar acceptances purchased by the Reserve Banks spawned an equally sharp decline in the value of acceptances issued in the U.S. By 1934 the value of dollar acceptances had fallen to barely half their sterling equivalent.

    Why was the dollar’s international position allowed to erode so dramatically?

    First, personnel mattered. Benjamin Strong, the influential governor of the Federal Reserve Bank of New York,was a confidant of Warburg, arguably his dearest friend. A die-hard internationalist, Strong appreciated the role of the Fed in supporting the global dollar. Strong died from tuberculosis in His successor, George Harrison, was less attuned to the need to support the market in dollar trade credits.

    Second, politics mattered. Glass had ascended to the Senate, where he chaired the influential Subcommittee on Banking and Currency. Glass blamed the Wall Street boom and bust on lax Fed regulations, adopted at Warburg’s insistence, and on Strong’s hyperactive support of the dollar acceptance market. Their actions, in his view, had fueled reckless speculation leading to the financial collapse, a view echoed by President Herbert Hoover. Glass now pressured the Fed to limit its purchases to acceptances financing merchandise trade. These “real bills” were safely collateralized by underlying merchandise, so they were guaranteed to perform. And because they financed legitimate economic activity, discounting them wouldn’t fan financial speculation.

    Sensitive to the criticism, the Reserve Banks curtailed their operations. Commercial banks, uncertain now about whether the central bank would guarantee the liquidity of the market, grew more reluctant to purchase acceptances. Eventually, America recovered from the Great Depression. Its once vital international acceptance market didn’t.

    It wasn’t until after World War II that the dollar became the leading global currency once again, in effect by default since the U.S. economy was the only one left standing. The Fed, having been chastened by the earlier experience, now acknowledged its responsibility to act as lender and liquidity provider of last resort, and thereby to promote and sustain the dollar’s dominant international role. That led to a remarkable streak of financial stability in the quarter-century following the war.

    The lessons for 2025 are clear. The dollar’s international primacy isn’t eternal. To be sustained, it has to be actively fostered and preserved. It must be supported by competent officials. An astute, experienced Federal Reserve head is key. Politicians interfere at their peril.

  • 2nd Quarter 2025

    OUR QUARTERLY NEWSLETTER TO CLIENTS AND FRIENDS OF THE FIRM

    SECOND QUARTER 2025


    Short-Term International Success, Long-Term Global Balance

    It’s mid 2025, and the world’s markets have flipped a long-standing script. For years, US equities led the global charge – especially the tech giants. But this year, that dominance has paused. Through the first half of the year, international stocks have surged roughly 18.5%, while the S&P 500 sits at a 6% gain.1 That divergence recalls past moments when leadership shifted from the US to Europe, Japan, or emerging markets – and signals we might be living through another such inflection.

    The most obvious catalyst has been the US dollar. The first half of 2025 saw the steepest drop in the dollar since 1973, which inversely means foreign currencies have strengthened considerably.2 These stronger foreign currencies enhance international stock returns, explaining much of the difference across the globe so far this year.

    There are deeper reasons behind this shift. In contrast with our Federal Reserve’s current positioning where rates have been held steady, central banks beyond the US have begun signaling rate cuts. Combined with fiscal stimulus – like Germany’s €500 billion infrastructure package and ramped-up defense spending – this has led to stronger earnings growth abroad.

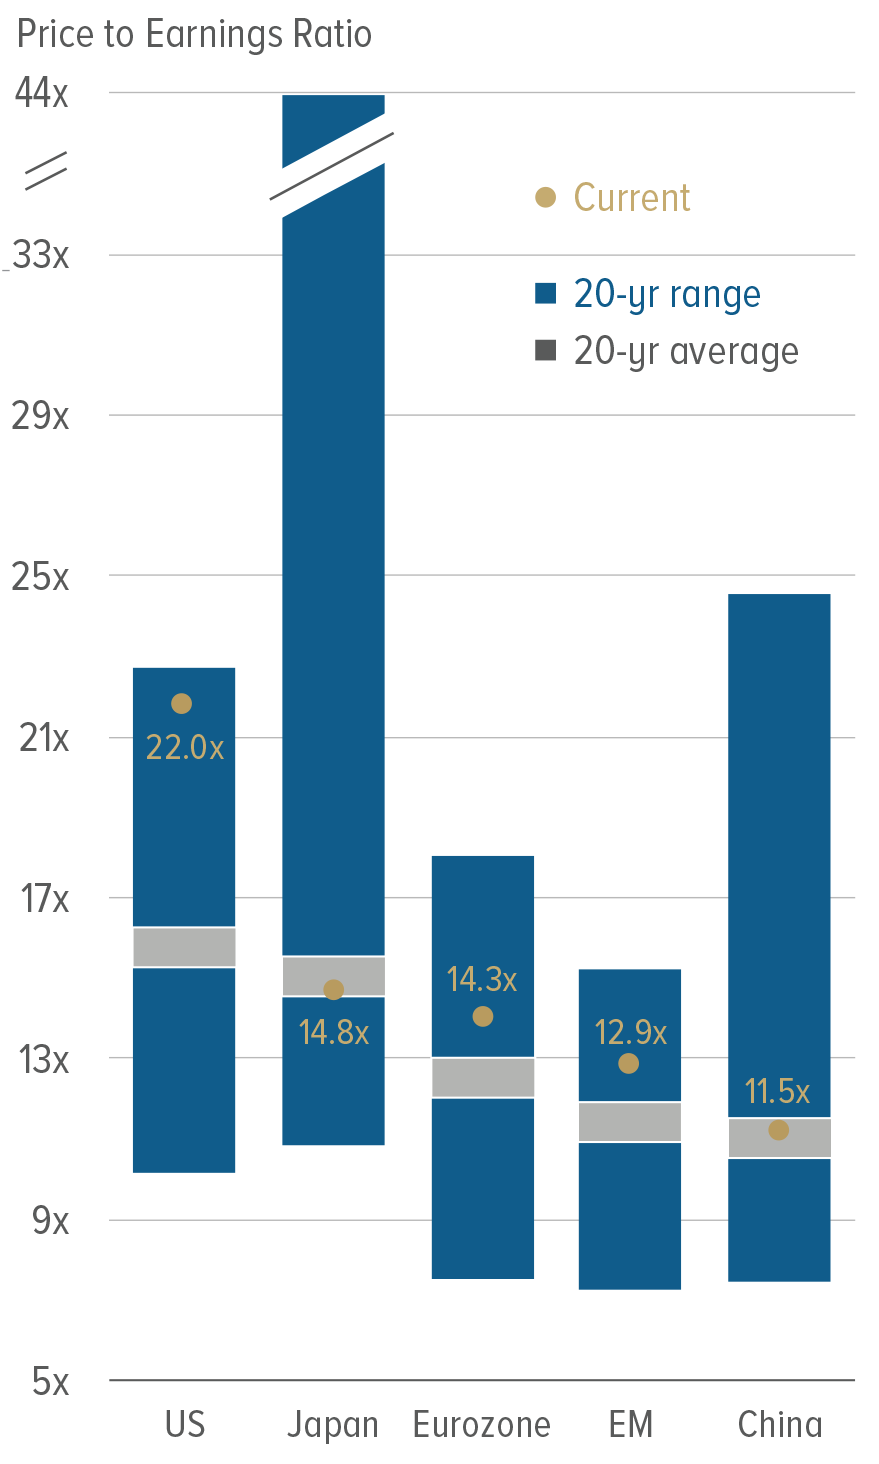
    As shown in Figure 1, valuations tell a similar story. US Stocks are currently valued far above their 20-year average, especially when compared to the rest of the world. These valuation differentials have historically followed with periods of strong catch-up performance. Over time, markets reprice the less expensive regions, delivering outsized returns to savvy investors who stay the course.

    Even within this narrative, US markets aren’t irrelevant – far from it. The S&P 500 climbed more than 10% in Q2, hitting fresh highs. American corporations and tech behemoths maintain global profitability and innovation leadership. But the recent outperformance abroad may reflect a broader shift: flow, valuation, and policy dynamics finally converging in favor of global markets.

    Beyond valuations and recent performance there are significant geopolitical factors to consider: looming tariff deadlines, renewed Middle East tensions, and talk of reshuffling Fed leadership have added uncertainty. These are global-level tremors, and in such times international markets – less tethered to US policy – have gained ground, reaffirming the timeless value of broad diversification.

    For us, the takeaway is both simple and strategic. US markets remain important, but anchoring your entire equity exposure domestically may miss this broader opportunity set. By holding a significant portion of equities outside the US, portfolios are positioned to benefit from current structural trends without sacrificing core US strength.

    But that doesn’t mean throwing caution into the wind. Global markets can face turbulence – tariff surprises, central bank shifts, geopolitical flare-ups. Yet those risks underscore the importance of diversification. When one market falters, another can provide ballast.

    The objective isn’t to chase every trend – but to build a portfolio that can stand on multiple legs. The past several years favored US markets. Today, maintaining global exposure isn’t a concession – it’s positioning for where returns and stability can align over the next chapter. A diversified equity allocation part US, part international, unhedged currency – harvests current trends while laying groundwork for future cycles.

    In the end, investing isn’t about picking a winner – it’s about assembling resilience. And as 2025 reminds us, that means embracing a world that includes US exceptionalism – but isn’t confined by it.

    ALL TIME HIGHS AREN’T NECCESSARILY A WARNING

    When markets reach all-time highs, many feel nervous. Yet history emphasizes why staying fully invested over the long term makes sense.

    Since 1950, the S&P 500 has hit over 1,300 all-time highs, accounting for roughly 7% of trading days. An investor avoiding investing during these time periods would be leaving serious money on the table. Notably, 29% of these highs acted as new “floors,” meaning the market never fell more than 5% afterward.3 In other words, time invested in the market is far more valuable than any attempt at outsmarting it.

    Staying fully invested means you benefit from compounding growth and avoid missing out on the market’s strongest days – often clustered around highs. Rather than holding back, being invested through peaks and valleys has proven to be a winning long-term approach. All-time highs are not exit signals – they’re reminders of markets’ enduring upward path.

    Figure 2

    ALL TIME HIGHS AND MARKET FLOORS
    S&P 500 Price Index, Daily, 1950-today

    IMPLICATIONS OF THE CHANGES MADE BY THE ONE BIG BEAUTIFUL BILL ACT.
    Speaker of the House Mike Johnson signs the One Big Beautiful Bill Act before sending it on to President Donald TrumpCHIP
    SOMODEVILLA/GETTY IMAGES NEWS/GETTY IMAGES

    Kim Kamin, Les Carter
    July 14, 2025

    On July 4, 2025, President Donald Trump signed into law the nearly 900-page One Big Beautiful Bill, a comprehensive package of tax cuts and fiscal policy changes. The bill includes significant modifications to individual, estate and business tax provisions. Several aspects of the bill may have a meaningful impact on tax and estate planning strategies.

    Transfer Tax Exemptions Increased

    Provision: The estate, gift and generation-skipping transfer (GST) tax exemptions, currently $13.99 million per person, were scheduled to be cut in half next year. The bill instead increases the base exemption to $15 million per person beginning in 2026 ($30 million per couple) and continues annual adjustments for inflation.

    Implications: With no scheduled sunset, the increased exemption provides additional transfer opportunities and benefits for clients. For most ultra-high-net-worth clients, lifetime gifting advice should remain the same as it was prior to the bill. While lifetime gifting strategies still offer meaningful benefits, clients with smaller estates may now also focus more on income tax planning, including strategies that preserve basis step-up at death.

    SALT Deduction Increased 

    Provision: For tax years 2025 through 2029, the state and local tax (SALT) deduction cap is raised to $40,000 per household, with this $40,000 limit phasing out for households with more than $500,000 in adjusted gross income (AGI). Beginning in 2026, the $40,000 cap increases 1% annually. In 2030, the cap returns to its current $10,000 level enacted in the 2017 Tax Cuts and Jobs Act (the TCJA).

    Implications: Taxpayers with AGI below $500,000 may benefit from accelerating SALT payments, recognizing income strategically, or bunching deductible expenses into the 2025–2029 window. For those near or above the income phase-out threshold, income-spreading strategies,  such as the use of multiple non-grantor trusts, may help preserve deductibility. These structures can potentially multiply the benefit of the increased deduction before the cap reverts to $10,000 in 2030.

    Income Tax Rates Established under the TCJA Preserved

    Provision: The bill locks in the lower income tax brackets enacted by the TCJA, which were originally set to expire after 2025. More specifically, the top marginal rate remains at 37% (rather than reverting to 39.6%). The broader bracket ranges, standard deduction expansion and compressed rate structure remain in place with no scheduled sunset.

    Implications: With the lower TCJA rates now continued, taxpayers can build long-term income recognition, charitable giving and trust distribution strategies with more confidence about marginal rate exposure. Families considering a Roth conversion may benefit from the certainty of the lower brackets, enabling them to convert at a reduced tax cost or bunch income into low-rate years without concern about a post-2025 rate increase.

    QSBS Election Benefits Expanded

    Provision: The bill enhances the benefits of Internal Revenue Code Section 1202’s qualified small business stock (QSBS) election by shortening the required holding period for partial gain exclusions and increasing eligibility thresholds. Taxpayers can now exclude 50% of gain after three years, 75% after four years and 100% after five years, while the lifetime gain exclusion cap increases to $15 million per issuer (up from $10 million), and the corporate asset threshold rises to $75 million, both indexed for inflation starting in 2027.

    Implications: These changes enhance the attractiveness of QSBS treatment for early-stage C corporation (C corp) investments, offering shorter holding periods for partial exclusions and a higher lifetime cap. Investors should review current and prospective QSBS holdings, assess eligibility based on the new asset threshold and consider how entity structure may impact qualification. The expanded benefits may also tilt the balance toward C corp status in certain situations where pass-through treatment was previously preferred.

    QBI Deduction Preserved

    Provision: The bill continues the 20% qualified business income (QBI) deduction, repealing the sunset provision that would have eliminated the deduction after 2025. This deduction allows owners of certain pass-through businesses, such as sole proprietorships, partnerships, S corporations and some trusts, to deduct up to 20% of their qualified business income, effectively reducing their taxable income and the marginal rate applied to it.

    Implications: With the deduction scheduled to continue, individuals with significant pass-through income can plan with greater certainty. Strategic income timing, aggregation elections and use of non-grantor trusts may continue to help preserve QBI eligibility. For clients engaged in specified service trades or businesses, proactive planning remains essential due to ongoing phase-out limitations based on income.

    Additional Items of Note

    • Trump accounts. Annual contributions up to $5,000 are permitted to a so-called “Trump Account” set up for an individual under 18 years old. These accounts provide for tax-free growth and withdrawals if used for qualifying purposes (for example, first-time home purchase). Certain income limits do apply. For individuals born between 2025 and 2028, Treasury will provide a one-time $1,000 contribution to an account for that individual.
    • Scholarship tax credits. Individuals who fund scholarships through approved nonprofit organizations receive a federal tax credit, effectively incentivizing private educational giving.
    • Charitable giving limits. Before a taxpayer can take a charitable deduction, a 0.5% AGI floor applies, and the cap on the deductibility of cash contributions to qualified charities was increased indefinitely to 60% of AGI.
    • No tax on tips or overtime. Eligible workers can deduct up to $25,000 per year in tip income (regardless of filing status) and up to $12,500 of qualified overtime pay ($25,000 per year if filing jointly), in each case subject to certain qualifications, income phase-outs and a 2028 sunset.
    • Car loan interest. Individuals may deduct up to $10,000 in auto loan interest for personal-use vehicles assembled in the United States. This deduction phases out above certain income levels and sunsets in 2028.
    • 2/37 limitation on itemized deductions. All itemized deductions are reduced by 2/37 of the lesser of: (1) the total itemized deductions; or (2) the amount of taxable income in excess of the top 37% bracket threshold. This doesn’t apply to determining the deduction for qualified business income from pass-through entities.

    Tax-Planning Opportunities

    The bill’s elimination of sunset and targeted expansions offer meaningful tax-planning opportunities, particularly for high-net-worth individuals and families. Some provisions, like the expanded SALT deduction, are time-sensitive.


    Posted on wealthmanagement.com

    Disclosures: Past performance is no guarantee of future results.
    1 International stocks are represented by the MSCI World Ex USA Index.
    2 Rennison, Joe. “The Dollar Has Its Worst Start to a Year Since 1973.” The New York Times, 30 June 2025.
    3 Source: FactSet, Standard & Poors, JP Morgan Guide to the Markets 7/10/2025. Figure 1 & Figure 2: Source: JP Morgan Guide to the Markets 7/10/2025.

  • 1st Quarter 2025

    OUR QUARTERLY NEWSLETTER TO CLIENTS AND FRIENDS OF THE FIRM

    FIRST QUARTER 2025


    Embracing Uncertainty

    Last October we sent out a flyer titled “Uncertainty is Underrated,” written by investment legend David Booth. In it, he emphasized that uncertainty should be embraced as the very reason we earn returns on our investments. Without risk, we’d have no reward. With the global stock market in a period of upheaval, we believe it’s essential to revisit the importance of portfolio diversification that serves to balance both sides of the risk reward equation.

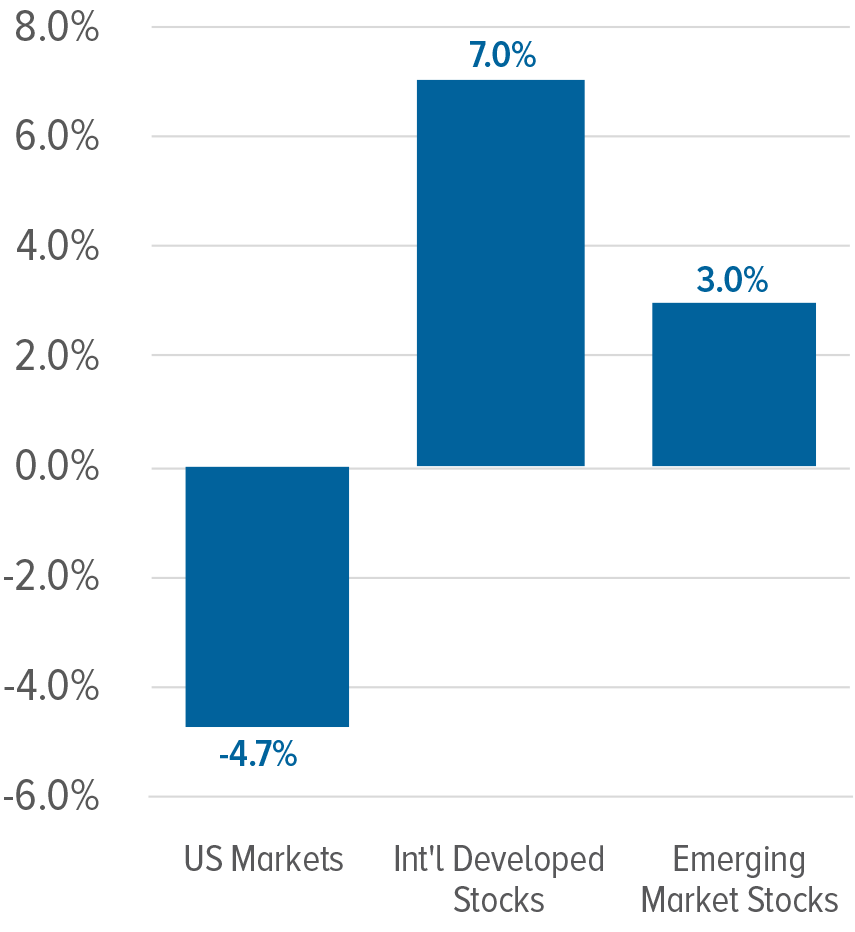
    As displayed in Figure 1, the first quarter of this year has been markedly different for US markets versus those abroad. International equities are (so far) outperforming domestic equities by a wide margin. Time will tell whether this trend continues into the future and for how long, but let’s take a look at some of the reasons for this performance disparity and how our portfolios are designed to adapt regardless of which asset class leads the charge.

    Economically, the U.S. pivot toward new tariffs and protectionist trade policy marks a notable departure from the era of global free trade. This shift introduces new pressure points for global supply chains and inflation. We’ve prepared for times like these by emphasizing both international diversification and targeting alternative investments in assets that have historically performed well during volatile periods. Both are designed to preserve purchasing power and generate returns in a changing macroeconomic climate.

    Geopolitically, the United States is stepping back from traditional roles in international military engagement and foreign aid, creating new risks and power vacuums in global affairs. Our portfolios’ broad international diversification, commitment to private assets, and exposure to fixed and floating rate bonds similarly help protect against these changes. By allocating across a wide range of global markets and regions, we aim to reduce exposure to any single country’s policy decisions and enhance resilience in the face of geopolitical volatility.

    Technologically, artificial intelligence is revolutionizing how businesses operate and compete. Rather than viewing this as a disruption, we see it as a powerful long-term opportunity. Our investment strategy includes exposure to all aspects of the AI ecosystem, from the leading technology firms driving innovation to the infrastructure, hardware, and energy sources powering this transformation. This balanced approach ensures our clients are positioned to benefit from AI’s growth while managing the risks that come with any major shift.

    Why Private Equity

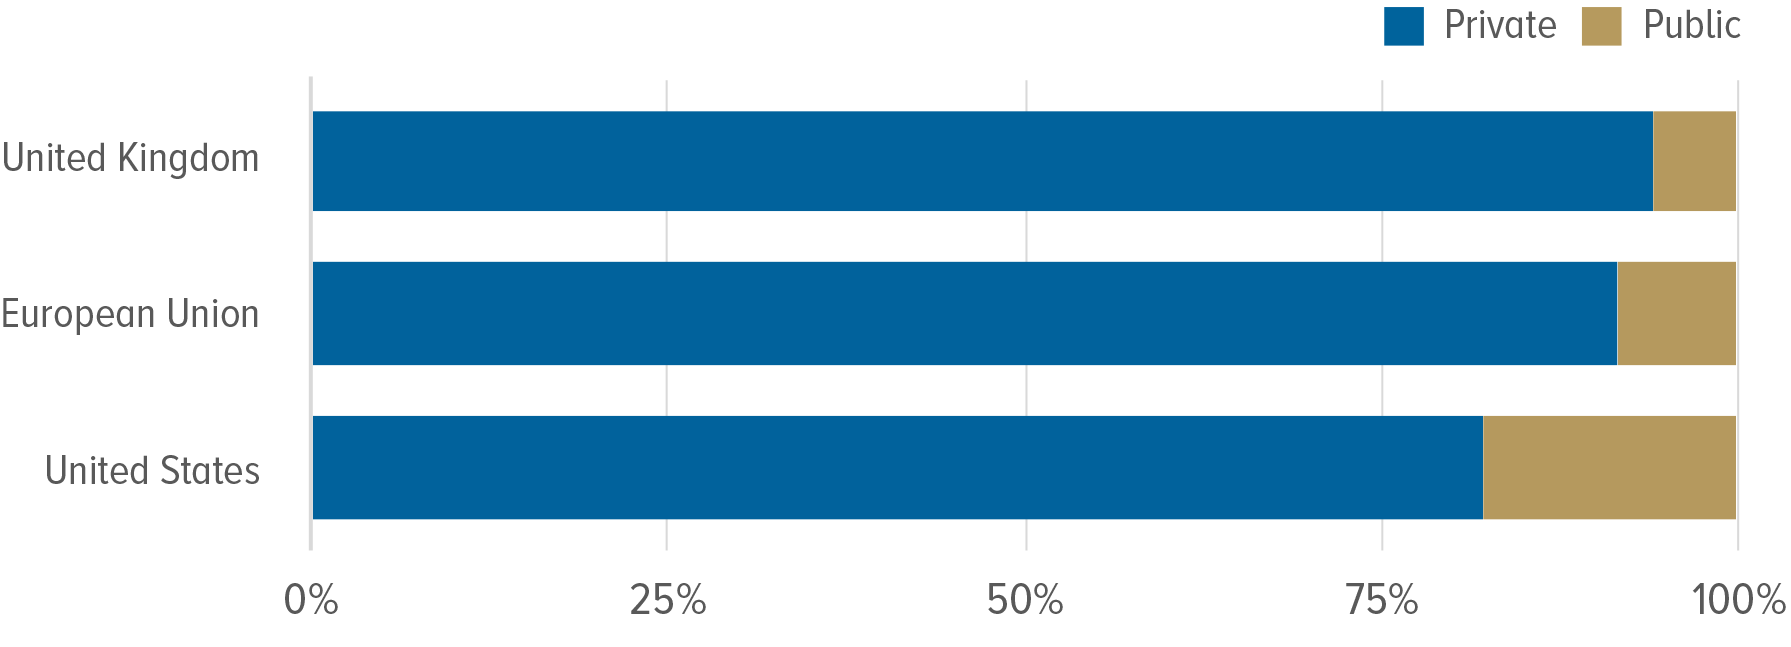
    Over the last few decades, the investment landscape has changed dramatically—and one of the most significant shifts has been the shrinking number of public companies. According to the US Census Bureau, the number of publicly listed U.S. stocks fell 24% from 1996 to 2020 while at the same time, the number of private companies surged 46%. Today, as shown in Figure 2, for every public company there are dozens of private businesses operating across industries and geographies. In short, if you want to truly “own the economy,” you need to own private equity.

    The forces keeping companies from going public vary but anecdotal evidence points to greater control for the founders, less regulatory burden, lower legal and other costs, and more of an ability to pursue long-term goals. These companies range from early-stage startups to mature firms undergoing ownership transitions. However, for most investors, gaining access to this market has historically been a challenge.

    For years, the only way to invest in private equity was through traditional drawdown funds, which are complex structures typically used by large institutions. These funds required investors to commit capital up front and wait for it to be “called” over several years as opportunities arose. Returns could take a decade or more to fully realize, and minimum investment sizes were often in the millions of dollars. For all but the ultra-wealthy or institutional investors, private equity was out of reach.

    That’s changing. A new generation of investment vehicles such as interval or evergreen funds has made private equity far more accessible. These structures allow individual investors to access professionally managed portfolios of private companies with lower minimums, simplified reporting, and greater diversification. While these vehicles are not as liquid as public investments, this lesser liquidity can actually be an advantage.

    Academic research supports the existence of an illiquidity premium, or the additional return investors can expect to earn for owning investments with limited liquidity. This premium, combined with the lower realized volatility of private investments, has been a key contributor to private equity’s historical outperformance over public market investments.1 This makes them unsuitable for money that may be needed in the short term, but entirely appropriate as part of a long-term investment strategy.

    As always, we approach private equity with the same discipline and due diligence we apply to every part of your portfolio. We believe that thoughtful allocation to private markets, balanced with the need for liquidity, risk tolerance, and long-term goals, can meaningfully enhance investment outcomes over time.

    By Hillary Chabot
    February 20, 2025

    As talk of tariffs, global trading, and domestic industry dominate the headlines, we asked Babson College Associate Professor of Economics Joshua Stillwagon to help break down the basics behind this international trade tactic—what are tariffs, why are they implemented, and who do they impact?

    “Tariffs are basically a tax on imported goods,” Stillwagon said. Tariffs can take various forms, such as a percentage of the imported goods’ value or a fixed fee per unit. While tariffs have been used for centuries, their effectiveness and economic consequences remain debated among economists and policymakers.

    “Although economists are generally negative on tariffs, targeted tariffs for certain consumer products could be rational in the short term to prevent ‘dumping’ by other countries, which may threaten the existence of our domestic industry,” Stillwagon explained. Dumping occurs when a company sells a product in another country at a lower price than in its home market.

    Governments impose tariffs for multiple reasons, said Stillwagon, who also serves as chair of Babson’s Economic Division. The primary motivations include:

    PROTECTING DOMESTIC INDUSTRIES
    One of the most cited reasons for implementing tariffs is to encourage domestic production by making imported goods more expensive. This can increase demand for locally produced alternatives, boosting profits and growth in the protected industry, at a cost to consumers.

    Stillwagon noted that their effectiveness depends on how they are structured.

    “If you want to boost production in the U.S., it’s better to have a more targeted approach,” Stillwagon cautioned. “Broad tariffs on essential materials like steel and aluminum increase costs for numerous industries, which would ultimately harm economic growth.

    GENERATING GOVERNMENT REVENUE
    Tariffs can serve as a source of income for the government, as companies importing goods must pay taxes upon entry. However, if tariffs significantly reduce imports, the revenue generated from them may diminish over time.

    TRADE NEGOTIATION LEVERAGE
    Tariffs can be used as a bargaining tool to encourage foreign governments to reduce their own tariffs or eliminate unfair trade practices, such as subsidies that allow foreign industries to sell products at artificially low prices in global markets.

    “The best argument for our tariffs is to use them as leverage to get other countries to remove their own tariffs or unfair trade practices,” Stillwagon said.

    While tariffs are designed to protect domestic industries, their effects can be widespread, Stillwagon said. The key groups affected by tariffs include:

    DOMESTIC COMPANIES
    Competition from imports can hurt domestic companies, leading to layoffs or shipping work overseas to cut costs. The recent 25% tariff imposed on foreign steel and aluminum will help U.S. steel and aluminum
    industries, for example.

    INFANT INDUSTRIES
    This type of tariff helps to foster growth in new or young industries “until they are more established and viable in the face of international competition,” Stillwagon said. For example, a country that imports cars might impose tariffs while they create a domestic auto industry.

    IMPORTING FIRMS AND INDUSTRIES
    Companies that rely on foreign materials or components face increased costs due to tariffs. For example, U.S. businesses that source steel, aluminum, or auto parts from abroad must pay additional taxes when these goods cross the border.

    “Tariffs on ‘upstream inputs’ like steel and aluminum will raise production costs for all the industries that need those materials,” Stillwagon said. “This will have some effect on raising inflation and reducing GDP growth compared to otherwise.”

    CONSUMERS
    As importing businesses pass on tariff-related costs, consumers often experience higher prices on everyday goods. This is especially true for essential items that are perishable or can’t be substituted, such as food and fuel.

    When a country imposes tariffs, affected trading partners may respond with their own tariffs on exported goods. In 2018, China, Canada and the EU responded by targeting politically-important sectors like American agricultural products, impacting U.S. farmers and food producers. Retaliatory tariffs can shrink export markets, leading to lower sales and potential job losses in affected industries, Stillwagon said.

    Another consequence of the tariffs is heightened economic uncertainty, which may cause businesses to delay investments and expansion.

    “Economic uncertainty discourages business investments,” Stillwagon noted. “Recent GDP data already show weak investment as a drag on growth. Without clear trade policies, companies may delay expansion.”

    Disclosures: Past performance is no guarantee of future results.
    1 Cornel, McDermott, & Win. Blackrock, August 2024. “On the Historical Outperformance of Private Equity”
    Exhibits are for illustrative purposes only.
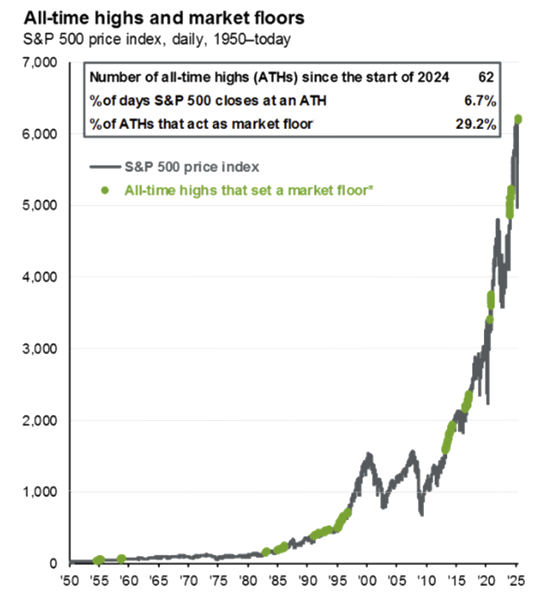
    Figure 1: Data from 1/1/25-3/31/25. US Stocks = Russell 3000 Index, Int’l Developed Stocks = MSCI EAFE Index, Emerging Market Stocks = MSCI EM Index.
    Figure 2: Data sourced from S&P Capital IQ and BlackRock as of February 24, 2025.

  • 4th Quarter 2024

    OUR QUARTERLY NEWSLETTER TO CLIENTS AND FRIENDS OF THE FIRM

    FOURTH QUARTER 2024


    2024 Year in Review

    There are few times more difficult to be a good long-term investor than when times are really great. The riskiest assets look extremely enticing, and investing in general looks all too easy. On the other side of the coin, in a crisis, investors in risky assets run for the hills while the diversified investor sees opportunities. Not dissimilar from the tortoise and the hare, the hare looks great when times are good but the tortoise wins the race in the end.

    More times than not the market gives us extremes, and these extremes test our discipline. Investors find themselves asking, “Things are really great, will this keep going?” Or, “Things are awful, how long can this last?” The S&P 500 reached a new all-time high 61 times last year; if that isn’t an extreme, I don’t know what is. Many things contributed to this record-breaking year, but a few of the major themes involve the Fed’s soft landing going according to plan, the market’s outlook regarding the election, and the optimism surrounding Artificial Intelligence creating a near perfect mix that delivered double-digit US stock returns.

    KEY TAKEAWAYS

    • US Stocks led the market in 2024, but their elevated valuations and reliance on the Magnificent 7 raise concerns about the sustainability of these returns.

    • International and Emerging Stocks delivered solid local currency returns but were held back by the strength of the US dollar.
    • Private Investments outperformed in the fixed income category, but returns were relatively muted for private equity and real estate.

    • Bonds and Real Estate struggled with higher interest rates, which have likely reached their peak.

    • Inflation has finally calmed down, leading to optimism amongst investors.

    As shown in Figure 1, you can see that US stocks led the charge this year, outperforming every other diversifying asset class. Bonds, the all important ballast for portfolios to protect investor savings from big market downturns, delivered only 1.3%. In a balanced portfolio comprised of 40% bonds that’s commonly used by investors, this had a huge effect on total returns for the year.

    It’s times like these that diversification has been called “Worsification”. In their local currencies, international developed country stocks delivered a solid double digit which was eaten by the huge US dollar rally. In the end, US investors in international stocks were left with just about 4%. The same effect left emerging markets investors with about 8% for the year. It’s not impossible that US stock market domination continues, but we have to concede that every dog has its day and it would be very unusual for the US or any other country to stay on top forever.

    Higher interest rates led Real Estate to struggle, with US making over 4% and international, again adjusted for the strong US dollar, at negative 7%. Alternatives did their job, with a 50/50 mix of Managed Futures and Style Premia delivering a 9% return.

    Our big push into private investments was a real winner for us in the Fixed Income category, helping replace some of that 40% of a balanced portfolio I mentioned earlier. While delivering strong returns over the long-term, private equity and real estate had relatively muted returns last year, again partly due to the higher borrowing costs compared to recent years. Private investments are priced based on real cash flows and valuations, whereas public market investments, particularly in the US recently, can see their prices soar and detach from the reality of their earnings. All told, 2024 delivered on our long-term objective of consistently beating inflation and increasing our clients’ buying power.

    While we don’t have a crystal ball, we do know that low risk investments are closer to long-term averages and are finally delivering an inflation adjusted return. That’s great news. US Stock and dollar valuations remain elevated, which might lead an investor to question how much more room they have to run. That said, among single stock analysts there is a near unanimous recommendation to invest in the Magnificent 7, the superstar stocks that now constitute more than a third of the S&P 500 by weight. In fact, US Stocks have returned nearly 17% per year since the market bottom in 2009. In a sense, the few drawdowns that have taken place since then have seemed to only reinforce the urge to go all-in on the S&P 500, because stocks have inevitably roared back.

    No one who entered the investment industry after 2010 has experienced a drawdown deeper than the short-lived 34% swoon of 2020 or longer than the nine-month, 25% peak-to-trough bear market of 2022. I have even overheard an investor saying “Stocks only go up.” Academic research and a number of long-term institutional investors, on the other hand, are sounding alarm bells. All things being equal, outsized historical returns are a negative indicator of future returns.

    International valuations are significantly lower than their US counterparts. This would be traditionally seen as a good sign for future investment returns, but over the short term that’s not a certainty. Will the US continue to dominate? Only time will tell.

    For real estate it’s again important to remember that current prices reflect where current interest rates are. If interest rates fall from here that will likely be a big tail wind for real estate. Even if interest rates stay where they are, there’s hope that the damage of rising interest rates may be over.

    In these times when diversification and prudence is being challenged it is good to swallow a big dose of perspective. Big picture, there have been four times when the US has experienced returns like recent times in the last 100 or so years. They all have names – the Roaring 20s, the Nifty Fifty, the Internet Bubble and whatever we want to call recent times, maybe the post Covid Stimulus/Meme Stock/AI boom? After these periods of well above average returns there’s usually a fall. Those all have names too – the Great Depression, 70s inflation, Internet Bust, and the Global Financial Crisis. Chasing short-term gains may be tempting, but disciplined and diversified portfolio design are key to navigating uncertainty and achieving long-term success.


    Fraud and cybercrime are serious threats—but you can take practical steps to protect your identity and assets. To reduce your exposure to fraud and reinforce your eff orts, Schwab has mechanisms in place to help safeguard your data and accounts.

    You can also have an impact on safeguarding your information and assets by following these guidelines and applying caution when sharing information and executing transactions. This checklist summarizes common cyber fraud tactics, along with tips, best practices, and actions to take if you suspect a breach.


    • Be suspicious of unexpected or unsolicited phone calls, emails, and texts asking you to send money or disclose personal information. If you receive a suspicious call, hang up, then call the client back, using a known contact number.
    • Be cautious when sharing sensitive information and conducting personal or confidential business via email because it can be compromised and used to facilitate identity theft.
    • Do not disclose on social media sites personal or sensitive information, such as your birth date, contact information, and mother’s maiden name.
    • Be cautious when receiving money movement instructions via email. Call the sender at their known number (not a number provided in the email) to verbally validate all instruction details before following instructions or providing your approval.
    • Protect yourself from phishing attempts and malicious links.
    • Check your email and account statements regularly for suspicious activity.
    • Do not verbally disclose or enter confidential information on a laptop or mobile device in public areas where someone could potentially see, hear, or access your information.
    • Verify payment requests you receive by phone or email. Requests for payment using gift cards, prepaid debit cards, or digital currency are frequently associated with fraud or scams.
    • Keep your web browser and operating system up-to-date and be sure you’re using appropriate security settings. Old software, operating systems, and browsers are more susceptible to attack.
    • Install anti-virus/anti-malware/ anti-spyware software on all computers and mobile devices.
    • Enable the security settings on your applications and web browser.
    • Do not use free or found USB thumb drives—they could be infected with viruses or malware.
    • Turn off Bluetooth when it’s not needed, to protect against individuals gaining access to your devices using Bluetooth connections.
    • Safely and securely dispose of old hardware.
    • Avoid using public computers. If you must use one, go to the browser settings and clear the browser history (cache) and cookies when you’re finished.
    • Use only wireless networks you trust or that are protected with a secure password.
    • Use your personal Wi-Fi hotspot instead of public Wi-Fi.
    • Do not accept software updates if you are connected to public Wi-Fi.
    • Do not use personal information such as your Social Security number or birth date as part of your user ID.
    • Create a unique password for each financial institution with which you do business; use passwords that are long and contain a combination of characters, numbers, and symbols. Consider using a password manager to create, manage, and store passwords that are unique and secure.
    • Do not share your passwords.
    • Use two-step verification whenever possible.
    • Check the URL to see whether it’s a secure connection. Secure sites begin with https rather than http and are generally considered safer.
    • Check the address bar for site validity indicators whenever you log in to a Schwab website. Some browsers use green text
      or security symbols to indicate a secure and verified site.
    • Download apps only from Google Play or Apple’s App Store.
    • Do not visit websites you don’t know—such as advertised in popup ads and banners.
    • Log out completely to terminate access when you’ve completed a secure session, such as for online banking or a credit card payment.
    • Do not click on links or attachments in emails and text messages if you question the validity of the sender. Instead, type the real web address, such as https://www.schwaballiance. com, in your browser.
    • Hover over questionable links to reveal the site’s full URL and see where the link really goes. Do not click on links that don’t match the sender or don’t match what you expect to see.
    • Be suspicious of emails that have grayed-out Cc: and To: lines—they may have been sent to a mass distribution list.
    • Check the sender’s domain name in the email address, such as john.doe@schwab.com, to see if it matches what you would expect to see.
    • Activate the spam filters in your email settings to help prevent unsolicited emails from going to your inbox.
    • If you suspect that an email appearing to be from Schwab is a phishing email, forward it to phishing@schwab.com.
    • If you have questions about an email from Schwab or personal information you entered about your Schwab account after clicking an email link, call your advisor or the Schwab Alliance
      team immediately at 800-515-2157.
    • Call your advisor or the Schwab Alliance team immediately at 800-515-2157
    • Ask your advisor if they have used Schwab’s How to Respond to a Data Breach flyer or have additional recommendations

    Visit these sites for more information and best practices:


    Schwab Advisor Services™ serves independent investment advisors and includes the custody, trading, and support services of Charles Schwab & Co., Inc. (“Schwab”).

    Independent investment advisors are not owned by, affiliated with, or supervised by Schwab. Schwab does not provide legal, tax, or compliance advice. Consult professionals in these fields to address your specific circumstance.

    Neither Schwab nor any of its affiliates or employees makes any warranty, expressed or implied, or assumes any liability or responsibility for the accuracy, completeness, regulatory compliance, or usefulness of any information, tools, resources, or processes described in this material or represents that its use would protect against cybersecurity or fraud incidents, including but not limited to a system breach, compromise of security, and improper access to confidential information. Neither Schwab nor any of its affiliates or employees is responsible for any damages or other harm that might occur as a result of, or in spite of, the use of any information, tools, resources, or processes described here. You are responsible for securing your own systems and data, including compliance with all applicable laws, regulations, and regulatory guidance.

    References in this material to any specific product, process, or service by trade name, trademark, manufacturer, or otherwise does not necessarily constitute or imply its endorsement, recommendation, or favor by Schwab.

    For general educational purposes.

    ©2022 Charles Schwab & Co., Inc. (“Schwab”). All rights reserved. Member SIPC. TWI (0722-2PVK) MKT112826-02 (08/22) 00252539

    Disclosures: Past performance is no guarantee of future results.
    Figure 1: Indices are not available for direct investment. Total returns calculated from 1/1/2024-12/31/2024, except for inflation which is calculated for the 12 months ending 11/30/2024. US Stocks = Russell 3000 Index. Int’l Stocks = MSCI EAFE Index (net div.). EM Stocks = MSCI Emerging Markets Index (net div.). Global RE = Dow Jones Global Select Real Estate Securities Index. Bonds = Bloomberg U.S. Aggregate Bond Index. Inflation = Consumer Price Index for All Urban Consumers. Alternatives = 50/50 mix of ASFYX/QSPIX’s calendar year 2024 total return.

  • 3nd Quarter 2024

    OUR QUARTERLY NEWSLETTER TO CLIENTS AND FRIENDS OF THE FIRM

    THIRD QUARTER 2024


    Investment Implications of Falling Interest Rates

    While history can’t predict the future, it can provide valuable insights into the possible outcomes. With the Federal Reserve’s recent interest rate cuts making waves in the markets, it’s wise to examine how different types of investments have performed in similar past scenarios.

    BONDS
    Bond prices tend to increase following interest rate cuts from the Fed. When rates decrease, newer bonds that are issued will offer lower returns than older ones, making existing bonds more desirable. As demand for these Investment Implications of Falling Interest Rates older bonds and their higher returns rises, their prices increase.

    This is an extremely simplified view, and factors such as recessions or other macroeconomic factors can complicate things. On the whole, however, we generally expect bonds to perform well in the face of falling interest rates and poorly as those rates rise.

    STOCKS
    Historical data shows that US stocks, as tracked by the S&P 500, have often performed well in the months following the Fed’s first rate cut. However, this depends on the health of the economy as a whole. Figure 1 shows examples of both scenarios, illustrating the performance of the US stock market following Fed rate cuts.

    The goal of rate cuts is to boost or sustain economic growth by lowering the price of borrowing and encouraging spending. Oftentimes this results in a boost to the stock market, however, as we saw after the dot-com bubble and the 2008 financial crisis, that’s far from a certain outcome.


    Figure 1

    S&P 500 RETURNS
    24 months following the start of Fed rate cutting cycles

    Line chart: S&P 500 returns in the 24 months after the start of five Federal Reserve rate-cutting cycles (June 1981, June 1989, January 2001, September 2007, July 2019)

    MONTHS FOLLOWING THE FIRST CUT


    CASH
    While cash is typically regarded as the safest type of investment, holding cash in a falling interest rate environment can lead to significant opportunity costs. When interest rates are low or declining, the real returns on cash, adjusted for inflation, can often be negative, which diminishes purchasing power over time.

    As cash returns diminish, many investors and savers may find it necessary to seek higher returns by moving into riskier assets. This shift often involves investing in securities like bonds and stocks to help meet their financial objectives.

    REAL ESTATE
    Lower interest rates generally benefit the real estate market by reducing borrowing costs for both homeowners and developers. With cheaper financing, demand for residential and commercial properties typically increases, which drives up property values. For property investors, these lower costs can lead to higher profits.

    However, falling rates can be a double-edged sword for real estate investors. While lower rates can boost property values and income, they can also lead to increased competition, as more buyers are drawn to the market.

    FINAL THOUGHTS
    The Federal Reserve’s interest rate cuts have broad effects across financial markets. Typically, falling rates benefit bonds and real estate while also creating opportunities in the stock market, especially for small-cap companies and cyclical industries. However, rate cuts often coincide with periods of uncertainty and volatility. To manage these fluctuations, investors should focus on diversification and long-term strategies that mitigate risks and capitalize on the opportunities present in a low-rate environment.

    THE BENEFITS OF
    INTERNATIONAL DIVERSIFICATION

    Investing in stock markets across the globe offers exposure to a broader range of economies, industries, and sectors than are found in the US market alone. As the saying goes, however, there’s no such thing as a free lunch. The diversification that’s provided by investing internationally often helps over the long term, but there’s no guarantee that these benefits will materialize in any specific period.

    A striking example of a period of time when international diversification helped tremendously was during what is often called “the lost decade” for US equities. Pictured in Figure 2, US stocks generated virtually no returns during this ten year stretch from 2000 through 2009, while international markets delivered solid gains. A portfolio consisting only of domestic US equities during this time period would’ve suffered heavily.

    In addition to the diversification provided by investing in the largest international developed countries, emerging markets offer access to fast-growing economies that tend to have lower correlations with the US market. Although emerging markets can be more volatile, they also have the potential for higher returns, which, when combined with US and international developed stocks, can help reduce overall portfolio risk.

    These diversification benefits can come with a price tag from time to time, however. For the ten years ending September 30th, the US has outperformed International Developed and Emerging Markets indices. Much of this underperformance can be attributed to the dominance of US mega-cap technology stocks, such as the Magnificent 7, which have driven much of the US market’s growth.

    Despite the recent lag in International and Emerging Market stock performance, they remain vital components of a well-diversified portfolio. By maintaining exposure to a broad range of markets, investors can better navigate periods of US market underperformance and benefit from the growth of economies outside the US.

    Figure 2

    THE LOST DECADE
    January 2000-December 2009

    Fortune logo

    By David Booth
    June 24, 2024

    David Booth is the founder and chairman of Dimensional Fund Advisors. This article is not intended as investment advice.


    Two men on trading floor
    Traders work on the floor of the New York Stock Exchange (NYSE) on June 18 after the S&P500 and Nasdaq closed at record highs the previous day. SPENCER PLATTE-GETTY IMAGES

    Given all that is going on in the world, investors have questions. Will the Federal Reserve cut interest rates, and if so, by how much? Who will win the U.S. presidential election, and will it impact markets? How will global events affect my family and finances? A lot remains uncertain, which can naturally make investors uneasy.

    For many people, uncertainty is something to avoid or at least mitigate. People often talk more about the downside to uncertainty than its upside. There’s even a term, loss aversion, that reflects how a loss can feel more painful than a gain of an equal amount can feel rewarding.

    However, I have a different view: Uncertainty is underrated. Without it, there would be no surprises, no joy in watching sports, and no 10% average annualized return on the stock market over the past century.

    All investments involve risk—there is no guarantee of success. Investors can be rewarded for taking on the risk of not knowing exactly how things will play out. If there was no uncertainty, returns would be predictable and there would be no difference between putting your money in a savings account and investing it in the stock market.

    Th ink back to the beginning of the pandemic. At the end of March 2020, the S&P 500 Index was down nearly 20% for the year. Yet investors who stayed in the market were rewarded. At the end of 2020, the S&P 500 Index was up 18.4% for the year, a 38% turnaround from its March lows. March 2020 was a scary time for almost everyone. No one knew what was going to happen. Yet even in those dark moments, I had faith in human ingenuity. When people are met with challenges, they are resilient and work to solve them. Companies are no different. Investing in the stock market means investing in the power of human ingenuity to adapt and innovate.

    Because of uncertainty, life is one cost benefit analysis aft er another, and we have no choice but to manage risk. At the extremes, some people may try to completely ignore risk, while others might try to eliminate it. Most of us fall somewhere in the middle.

    We manage risk with our health, work, family, and just about every other aspect of our lives—including investing—because while few things are certain, we still have to make decisions big and small. For example, we can’t control the weather, but we can carry an umbrella if it looks like it might rain. And while we can’t predict stock market returns, we can manage the risk in our investment portfolios.

    What to avoid

    One way of managing risk is to eliminate some of the things you shouldn’t do. When you want to improve your health, you might eliminate fried foods, soda, and sweets from your diet, which can increase your chance of a healthier outcome. It’s the same with investing. Eliminate bad habits, like attempting to predict the unpredictable by trying to time the market or pick winning stocks.

    Think of everything that has happened in the past 25 years, including:

    • The dot-com bubble.
    • 9/11.
    • The Global Financial Crisis
      and Great Recession.
    • The COVID-19 pandemic.


    It would be natural to want to time when to exit and re-enter the market. To put the implications of doing so into perspective, consider a hypothetical $1,000 investment in the Russell 3000 Index made at the beginning of 1999. This turns into $6,449 for the 25 years ending Dec. 31, 2023. Over that same period, if you missed the Russell 3000’s best week, which ended Nov. 28, 2008, the value shrinks to $5,382. Miss the three best months, which ended Jun. 22, 2020, and the total return dwindles to $4,546. See what I mean?

    What to do

    Positive ways of dealing with risk can help you potentially capture the benefits of what scientific research has shown us. With health, that means exercising more, getting regular checkups, and eating more fruits and vegetables. With investing, that means ensuring our portfolios are diversified across regions and asset classes. While it doesn’t guarantee making a profit or averting a loss, diversification allows us to reduce our risk while potentially capturing the returns of the market.

    Since we know risk is unavoidable—and it’s the source of investment returns—you want to find the amount of risk that is right for you. For example, Treasury bills are considered a relatively safe investing asset whose prices don’t fluctuate as much as stock prices. However, Treasurys have provided, on average, a lower return than the stock market. Those tradeoffs can be weighed against your specific needs and preferences, and it’s always good to be prepared for a range of outcomes. The more committed you are to a philosophy and a plan you can count on when you are experiencing the ups and downs of uncertainty, the more likely you are to succeed as a long-term investor.

    You are already better at this than you think.

    You know more about investing than you think you do, because investing is all about risk and reward, just like every other part of your life. In investing and in life, some years are better than others, but the important thing is to be able to persevere so you’re ready for what comes next. That’s why I see uncertainty as a positive force and have faith in the ability of people to find better ways to manage risk. I’ve worked with thousands of investors during my five decades in finance and seen how, when they manage risk better, they live a better life. Instead of trying to predict your future, plan, adapt, and figure out the most sensible solutions for you.

    You may not only be underestimating uncertainty—you may also be underestimating the positive impact of embracing it.

    Disclosures: Past performance is no guarantee of future results. Exhibits are for illustrative purposes only.

    Figure 1: S&P 500 returns begin using the month of returns listed and continue for 24 consecutive months.
    Figure 2: Emerging Market Stocks = MSCI Emerging Markets Index (net div.), International Developed Stocks = MSCI EAFE Index (net div.), US Stocks = S&P 500 Index

  • 2nd Quarter 2024

    OUR QUARTERLY NEWSLETTER TO CLIENTS AND FRIENDS OF THE FIRM

    SECOND QUARTER 2024


    Portfolio Concentration & Biases

    This year’s numerous all-time highs in the S&P 500 are largely driven by NVIDIA, which alone accounts for nearly one third of the index’s performance in the first half of 2024. Adding Microsoft, Amazon, Meta (Facebook), and Eli Lilly into the mix covers over half of the index’s strong performance.

    While it may be tempting to invest heavily in these standout performers, concentrating your investments in a few stocks can be extremely risky. I’ve summarized a few of my favorite studies highlighting these risks in Figure 1. On the other hand diversifying your portfolio helps mitigate the risks associated with betting on one or even a few stocks.

    Figure 1

    STUDIES ON STOCK CONCENTRATION

    Singled Out: Historical Performance
    of Individual Stocks 1927-2020
    By Bryan Ting and Wes Crill

    Ting and Crill found that only about 20% of stocks outperformed the market over 20 years. Stocks are prone to delisting and decline even if they have performed well historically. Their study confirms that past performance does not reliably predict future success, with winners having no better chance of continued outperformance than losers.

    Underperformance of Concentrated
    Stock Positions 1926-2022
    By Antti Petajisto

    Individual stocks underperformed the market by a median of -7.9% over ten years. The stocks that were recent top performers did even worse. The study highlights that the odds of a concentrated position outperforming the market are slim, especially if the stock has performed exceptionally well recently.

    The Capitalism Distribution 1983-2007
    By Longboard Asset Management

    Out of the top 3,000 stocks in the US, 39% lost money, and 19% saw losses exceeding 75%. Additionally, 64% underperformed the Russell 3000 Index. This highlights the inherent risk of relying heavily on a single stock: the chance of significant loss is high.

    Wealth Creation in the US Public
    Stock Markets 1926-2019
    By Hendrik Bessembinder

    This study’s findings reveal that while a few high-performing stocks generate significant market returns, nearly 60% of stocks diminish shareholder wealth. Most importantly, only 4% of stocks outperformed Treasury bills, and fewer than 1% of stocks were responsible for over half of the wealth creation. This skewed distribution means that the odds of a single stock delivering exceptional returns are slim.

    Although everyone knows, and the evidence supports, that diversification is a good idea in theory, it’s worth taking a look at why it is often brushed aside in practice. There are several behavioral biases that we as human beings exhibit, and these go a long way towards explaining this departure.

    1. FAMILIARITY BIAS

    Investors overestimate the safety of familiar stocks, such companies that have been regularly highlighted in the press. This overconfidence often leads to underestimation of the risks involved.

    2. RECENCY BIAS

    This bias also plays a role, where investors are influenced by recent strong performance and project these results into the future. This can result in buying or continuing to hold onto a stock based on its past performance, even if current valuations are high and future returns are uncertain.

    3. ANCHORING BIAS

    When investors irrationally hold assets based on their initial purchase price, rather than evaluating the current value of the investment.

    4. CONFIRMATION BIAS

    This is one we’ve all heard of before, but in investing this occurs when individuals ignore negative news about a stock and only pay attention to information that supports their views.

    5. HERD MENTALITY BIAS

    Essentially the tendency to follow the crowd. Investors tend to feel more confident when purchasing securities that all their friends or the media are discussing. This tends to work great on the way up, but not so much on the way down.

    All these biases above can combine and contribute to concentrated portfolios. In contrast, diversification is often described as the only “free lunch” in investing. By spreading investments across a range of assets and recognizing our own human biases, investors not only reduce risk but also enhance the chances of achieving better long-term returns.

    NEW TAX SAVING STRATEGY

    While both death and taxes remain inevitable, our new tax-saving strategy can help delay at least one. We have been using individual stock portfolios to aggressively harvest tax losses for some 20 years (the strategy has just recently made its way to the mass market under the moniker “Direct Indexing”). Our new Flex strategy, which we began to roll out at the beginning of this year, represents the latest and most advanced effort to maximize after-tax returns. Unlike previous strategies that involve swapping stocks when they fall below their original cost basis, Flex takes tax loss harvesting to a whole new level.

    By using margin and shorting (which may sound intimidating), we buy favorable stocks and short less favorable stocks. Definitionally, we benefit when stocks we’re long go up in price and when stocks we’re short go down in price. Thus, we’re able to capture losses whether stocks go up or down and later use them to offset capital gains which reduces our ultimate tax bill.

    Figure 2 compares the live results of this strategy to the target US market return of the Russell 3000 and even shows the tax benefits. Results will vary, but Flex can significantly benefit clients with liquidity events (think the sale of a company or property), minimize portfolio capital gains taxes, and enhance the effectiveness of charitable giving. Although this strategy is not appropriate for all clients, in the right situation it’s designed to significantly reduce yearly tax bills.

    Figure 2

    DESIGNED TO PERFORM BEFORE AND AFTER TAXES
    Flex 145 All Cap Equity Composite Net of Fee Performance, as of March 31, 2024

    Understanding the best way to tap your IRAs and other accounts
    can help you preserve your savings and lower your tax bill.

    By Sandra Block
    June 19, 2024

    One of the upsides of retirement is that for the first time in years, you have control over your time. If you want to spend the afternoon watching Bonanza reruns, well, no one is going to stop you.

    Retirement also gives you more command over your money. While you’re working, you have limited control over how often or how much you’re paid, which limits your ability to lower your taxes. But if you’re drawing retirement income from a combination of different types of accounts, you can control not only the amount you withdraw but also the sources of those withdrawals — and that could have a big impact on your taxes now and in the future.

    Conventional wisdom has long held that retirees should take money from their taxable brokerage accounts first, followed by traditional IRAs and other tax-deferred accounts, with Roth IRAs and Roth 401(k)s coming last. The logic behind this strategy is that it gives your tax-advantaged accounts more time to grow. Money in tax-deferred accounts isn’t taxed until you take withdrawals, and withdrawals from a Roth are tax-free as long as you’re 59 1/2 or older and have owned the account for at least five years.

    But in recent years, some retirement experts have questioned whether this is the most effective way to lower taxes on your retirement income and preserve your savings for your later years. Postponing withdrawals from your tax-deferred accounts could eventually lead to large, taxable required minimum distributions (RMDs currently start at age 73).

    And since those withdrawals are taxed at ordinary income tax rates, which range from 10% to 37%, large distributions could push you into a higher tax bracket and trigger Medicare high-income surcharges, says Wade Pfau, professor of retirement income at the American College of Financial Services and author of Retirement Planning Guidebook: Navigating the Important Decisions for Retirement Success.

    Roger Young, a certified financial planner and thought leadership director for T. Rowe Price, agrees. The conventional withdrawal sequence “bunches a lot of taxable income in the middle period, where pretty much all of your income is taxable,” he says.

    Retirees who have a mix of accounts could generate income more tax-efficiently by withdrawing from a combination of taxable and tax-deferred accounts, as well as making strategic conversions to Roth accounts, while remaining in a low tax bracket, Pfau says. One way to accomplish this goal is to withdraw enough from your taxable accounts to cover spending needs and income taxes. After that, calculate how much you can withdraw from your tax-deferred accounts and convert to a Roth while remaining within your desired tax bracket.

    In 2024, a married couple who fi les jointly can have up to $94,300 in taxable income and fall within the 12% tax bracket; for singles, the cutoff is $47,150. These thresholds are close to the points at which taxpayers can qualify for a 0% tax rate on long- term capital gains and qualified dividends (assets held for more than a year are subject to rates for long-term gains). In 2024, the 0% rate applies to capital gains and qualified dividends for singles with taxable income up to $47,025 and married couples with joint taxable income up to $94,050.

    Taking strategic withdrawals from a mix of taxable and tax-deferred accounts while remaining within these thresholds provides two benefits. You’ll pay taxes on your tax-deferred withdrawals at a low rate and reduce the size of those accounts, which will shrink your RMDs. You may also qualify for the 0% capital gains rate on income from your taxable accounts.

    Meanwhile, you’ll pay taxes on conversions from a traditional IRA to a Roth at a low rate, which will increase the amount of tax-free income you’ll have available in later years. Ideally, you should use assets from your brokerage or other taxable accounts to pay taxes on the conversions, Pfau says.

    If you postpone Roth conversions until you’ve depleted those accounts, you may have to use funds from your IRA to pay the tax bill. That’s not the end of the world, he says, because you’ll still benefit from having future tax-free income (and if you’re 59 1/2 or older, you won’t pay a 10% early-withdrawal penalty on those distributions). But it reduces the amount of money you’ll be able to invest in the Roth.

    Taxes on Social Security

    Converting funds in your traditional IRAs to a Roth can help reduce your taxable income later in life because, ideally, a large percentage of your withdrawals will come from your Roth. This will help you avoid what Pfau calls the Social Security “tax torpedo,” which occurs when up to 85% of your benefits are taxed.

    The formula for calculating tax on Social Security benefits is based on what Social Security defines as your provisional income (sometimes referred to as combined income), which is based on half of your Social Security benefits, plus other sources that contribute to your adjusted gross income, including withdrawals from traditional tax-deferred accounts; dividends, interest and capital gains from taxable investment accounts; and interest from municipal bonds.

    If your provisional income ranges from $25,000 to $34,000 for single filers, or $32,000 to $44,000 for joint filers, up to 50% of your benefits will be taxable. If your provisional income is more than $34,000, or $44,000 for joint filers, up to 85% of your benefits will be taxable.

    These thresholds aren’t adjusted for inflation, which means the percentage of retirees who pay taxes on their benefits has increased dramatically since the tax was signed into law more than 30 years ago. More than half of retirees pay taxes on a portion of their Social Security benefits, according to the Center for Retirement Research at Boston College.

    Withdrawals from a Roth aren’t included in your provisional income, so increasing the size of your Roth accounts through strategic conversions can help lower taxes on your benefits. If you’re able to delay filing for Social Security until age 70, which will maximize the amount of your monthly payouts, you’ll have more time to reduce the size of your tax-deferred accounts and convert some of your funds to a Roth, T. Rowe Price’s Young says.

    Charitable Giving

    If you plan to give funds in your tax-deferred accounts to charity, you may not need to accelerate certain withdrawals as much as you would otherwise.

    One strategy that can reduce your RMDs — and your tax bill — is to make qualified charitable distributions (QCDs), which are donations made directly from your IRA to qualified charities. You can make a QCD as early as age 70 1/2, but when you reach the age at which you’re required to take distributions, the charitable distribution will count toward your RMD.

    Although a QCD isn’t deductible, it will reduce your adjusted gross income, which will in turn reduce the provisional income used to calculate taxes on your Social Security benefits. In 2024, you can donate up to $105,000 directly from your IRA to a qualified charity.

    Alternatively, if you’re worried about giving away money you may need for long-term care or other late-in-life expenses, you can leave funds in your IRA to charity. The charity won’t have to pay taxes on the money, and you can leave more tax-friendly assets to your heirs. But this won’t absolve you from taking RMDs and paying taxes on those withdrawals while you’re still alive.

    Your Estate and Taxes

    Shifting more of your assets to Roth accounts won’t just lower your taxes in your later years. It could also benefit your heirs if they end up inheriting money in those accounts.

    Under the SECURE Act of 2019, most adult children and other non-spouse heirs who inherit a traditional IRA or other tax- deferred account from an owner who died on or after January 1, 2020, have two options: Take a lump sum and pay taxes on the entire amount, or transfer it to an inherited IRA and deplete the account within 10 years of the death of the original owner.

    Depending on whether the original owner was taking RMDs when he or she died, the heirs may also have to take yearly withdrawals based on their life expectancy, which could mean paying taxes during their highest-earning years. (Spouses still have the option of rolling inherited IRAs into their own IRAs.) Because of confusion about the rules, the IRS has waived the RMD requirement for non-spouse heirs the past few years and is doing so again for 2024.

    The 10-year rule also applies to inherited Roth IRAs, but heirs aren’t required to pay taxes on the withdrawals or to take RMDs. That gives them plenty of flexibility, including the ability to wait until year 10 to deplete the account, thereby taking advantage of more than a decade of tax-free growth.

    If you have a large brokerage account with significant appreciation, you may want to consider preserving some of those assets for your heirs. Under current tax law, inherited investments receive a “step-up” in their cost basis to the current fair market value when the original owner dies. If your heirs turn around and sell those investments right away, they won’t pay tax on any gains, no matter how much the investments have increased in value since you purchased them.

    Note: This item first appeared in Kiplinger Personal Finance Magazine, a monthly, trustworthy source of advice and guidance.

    Disclosures: Past performance is no guarantee of future results.

    1 The tax benefit liability is calculated using a pre-liquidation calculation methodology reflecting the impact of realized tax outcomes. It is calculated as the difference between the geometrically annualized monthly after-tax returns and similarly calculated pre-tax returns reflecting an assumed monthly reinvestment of tax benefits (liabilities) into (out of) the portfolio. The calculation methodology only considers federal tax rates (assumes -40.8% for short term capital gains/losses and ordinary income/expense and -23.8% for long-term capital gains/losses and qualified divided income) and excludes the potential state tax benefit (liability). Potential Federal tax benefit and after-tax returns are for illustrative purposes only and may not reflect all taxes that an investor would incur.

    Figure 2 Sources: AQR, Bloomberg. XpressFeed, Barra. Performance data is estimated and subject to change. Past performance is not a guarantee of future performance. Unaudited net returns shown in USD. Flex 145 All Cap Equity – formerly Flexible SMA – Beta 1 Low TE US All Cap Equity – formerly Enhanced Direct Indexing – Tax Aware US All Cap Equity Composite net performance calculated based on 0.4% model mgmt. fee, per annum. Other discretionary portfolios that trade similar securities and/or strategies as those portfolios included in this composite, but do not meet this composite’s strategy criteria, are excluded from this composite and reside in one or more separate composites, which are available upon request. The GIPS Composite Reports for FLex 145 All Cap Equity Composite can be found in Disclosures.